LFP MEASURES BY MARITAL STATUS
TOTAL POPULATION BY MARITAL STATUS
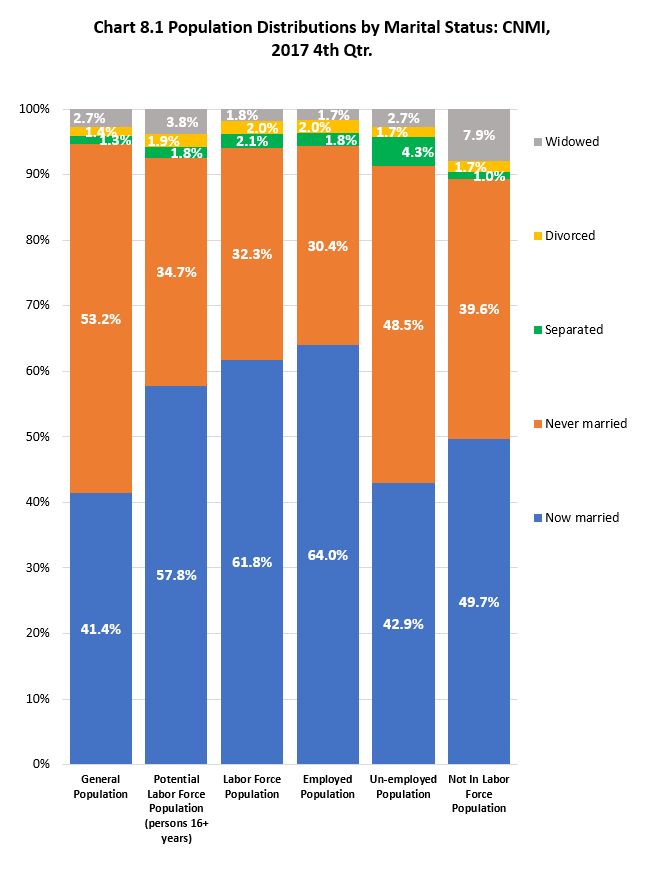
The never married was 53% (27,821) of the estimated total population in the CNMI at the time of the Survey. However, it is important to keep in mind that this group includes all ages. The now married group was 41% (21,648), widowed was 3% (1,428); divorced and separated, combined, was also 3% (1,367).
POTENTIAL LABOR FORCE POPULATION BY MARITAL STATUS
Now married was 62% (15,512) while never married was 32% (8,116) of the potential labor force population in the Commonwealth at the time of the Survey.
LABOR FORCE POPULATION BY MARITAL STATUS
Now married was 58% (21,629) while never married was 38% (12,995) of the labor force population in the Commonwealth at the time of the Survey.
EMPLOYED POPULATION BY MARITAL STATUS
Now married was 64% (14,377) while never married was 30% (6,833) of the employed population in the Commonwealth at the time of the Survey.
UNEMPLOYED POPULATION BY MARITAL STATUS
Never married was almost half (49%, 1,283) while now married was 43% (1,135) of the unemployed population in the Commonwealth at the time of the Survey.
NOT IN LABOR FORCE POPULATION BY MARITAL STATUS
Now married was half (50%, 6,117) while never married was 40% (4,879) of the not in labor force population in the Commonwealth at the time of the Survey.
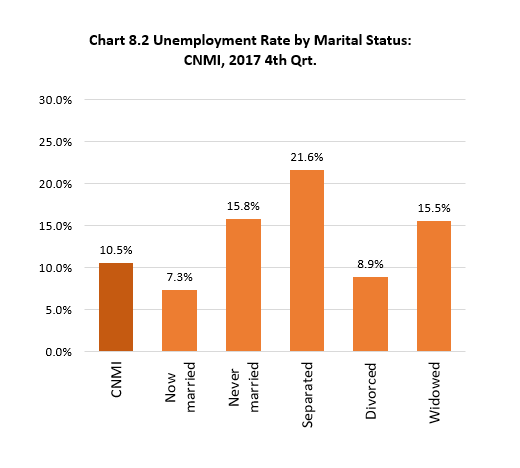
UNEMPLOYMENT RATE BY MARITAL STATUS
Now married had the lowest unemployment rate of 7.3%, followed by divorced (8.9%), widowed (15.5%), never married (15.8%), and then separated (21.6%).
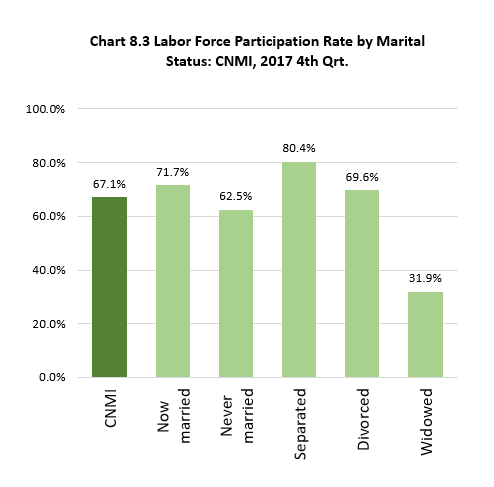
LABOR FORCE PARTICIPATION RATE BY MARITAL STATUS
Separated had the highest labor force participation rate (80.4%), followed by now married (71.7%), divorced (69.6%), never married (62.5%), and then widowed (31.9%).
LFP 2017 Table8.0-1
Labor Force Participation Measures by Marital Status: CNMI, 2017 4th Qtr.
| Marital Status | General Population | Potential Labor Force Population (persons 16+ years) | Labor Force Population | Employed Population | Unemployed Population | Not In Labor Force Population | Unemployment Rate | Labor Force Participation Rate |
|---|---|---|---|---|---|---|---|---|
| Source: LFP 2017 CNMI CSD | ||||||||
| Now married | 21,648 | 21,629 | 15,512 | 14,377 | 1,135 | 6,117 | 7.3 % | 71.7 % |
| Separated | 658 | 658 | 529 | 415 | 114 | 129 | 21.6 % | 80.4 % |
| Widowed | 1,428 | 1,428 | 456 | 385 | 71 | 972 | 15.5 % | 31.9 % |
| Divorced | 709 | 709 | 493 | 450 | 44 | 215 | 8.9 % | 69.6 % |
| Never married | 27,821 | 12,995 | 8,116 | 6,833 | 1,283 | 4,879 | 15.8 % | 62.5 % |
LFP 2017 Table8.0-2
Labor Force Participation Measures by Marital Status: CNMI, 2017 4th Qtr.
| Marital Status | General Population | Potential Labor Force Population (persons 16+ years) | Labor Force Population | Employed Population | Un-employed Population | Not In Labor Force Population |
|---|---|---|---|---|---|---|
| Source: LFP 2017 CNMI CSD | ||||||
| Now married | 41.4% | 57.8% | 61.8% | 64.0% | 42.9% | 49.7% |
| Never married | 53.2% | 34.7% | 32.3% | 30.4% | 48.5% | 39.6% |
| Separated | 1.3% | 1.8% | 2.1% | 1.8% | 4.3% | 1.0% |
| Divorced | 1.4% | 1.9% | 2.0% | 2.0% | 1.7% | 1.7% |
| Widowed | 2.7% | 3.8% | 1.8% | 1.7% | 2.7% | 7.9% |
To download chart, right click on the chart and select “Save Image As”…