LFP HOUSING CHARACTERISTICS BY MICROWAVE
CNMI Total
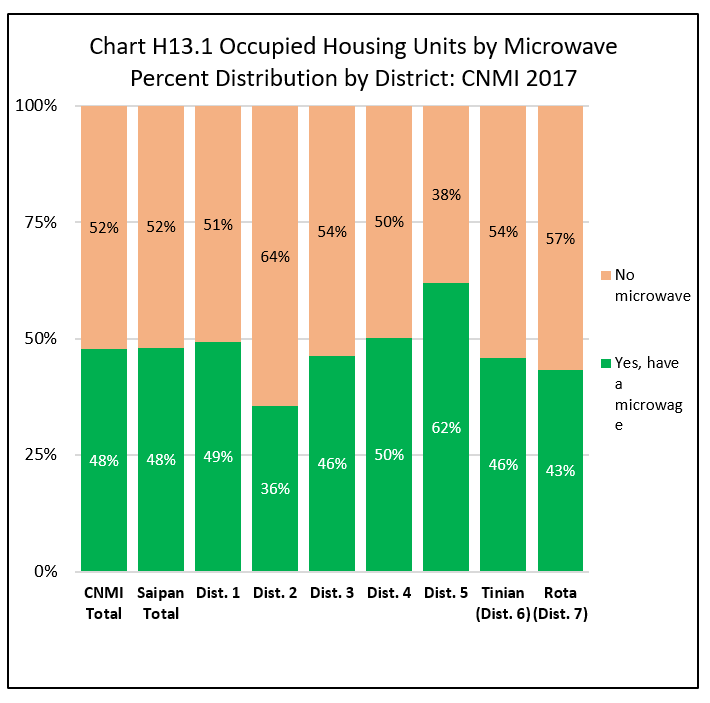
Units with a microwave was 47.8% of all occupied housing units in the CNMI in 2017 while units with no microwave was only 52.2%.
By Island
The percentage of occupied units with a microwave was highest in Saipan (48.1%), followed by Tinian (45.9%), and lowest in Rota (43.3%). Conversely, the percentage of occupied units with no microwave was 56.7% in Rota, 54.1% in Tinian, and 52.2% in Saipan.
By Saipan Districts
Within Saipan, the percentage of all units with a microwave was highest in Districts 5 (62.0%) and was lowest in District 2 (35.6%). See Chart H13.1 and Table H13.1 for detail.
Housing Characteristics
LFS 2017 Table H13.1
Labor Force Participation Measures
Table H13.1 Occupied Housing Units by Microwave, by Island, and by District: CNMI, 2017 4th Qtr.
| Saipan District 1 |
Saipan District 2 |
Saipan District 3 |
Saipan District 4 |
Saipan District 5 |
Tinian District 6 |
Rota District 7 |
||
|---|---|---|---|---|---|---|---|---|
| Source: Labor Force Survey CNMI, 2017 4th Qtr. | ||||||||
| Microwave | Yes, have a microwave | 2,135 | 729 | 2,556 | 564 | 1,252 | 413 | 331 |
| Microwave | No microwave | 2,197 | 1,321 | 2,966 | 558 | 766 | 486 | 434 |
| Percent within | Yes, have a microwave | 49.3% | 35.6% | 46.3% | 50.3% | 62.0% | 45.9% | 43.3% |
| Percent within | No microwave | 50.7% | 64.4% | 53.7% | 49.7% | 38.0% | 54.1% | 56.7% |
| Percent by | Yes, have a microwave | 26.8% | 9.1% | 32.0% | 7.1% | 15.7% | 5.2% | 4.1% |
| Percent by | No microwave | 25.2% | 15.1% | 34.0% | 6.4% | 8.8% | 5.6% | 5.0% |
Housing Characteristics
To download chart, right click on the chart and select “Save Image As”…