LFP MEASURES BY MIGRATE REASON
TOTAL POPULATION BY MIGRATE REASON
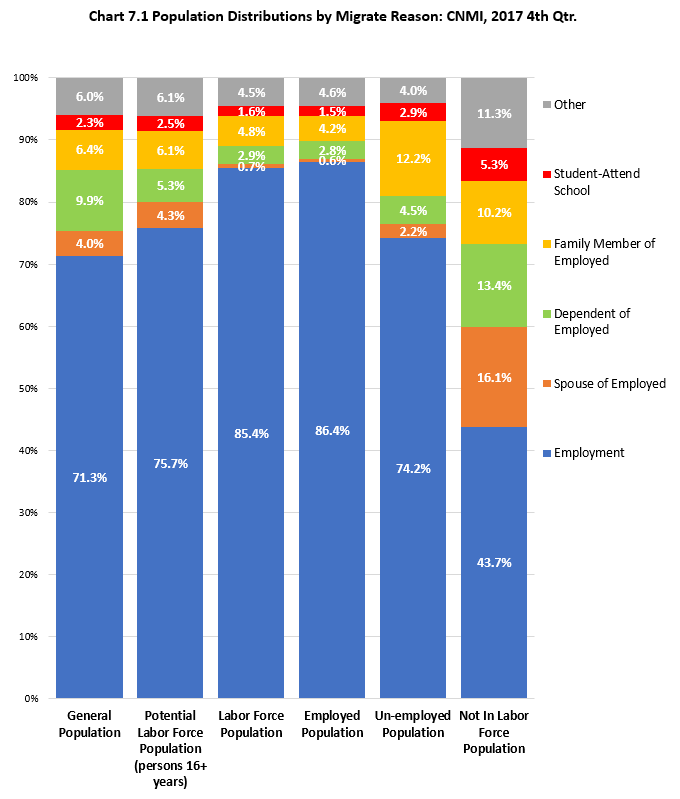
As noted in the previous section, 43% (22,645) of the estimated total population was born elsewhere and migrated into the CNMI while 57% was born within the Commonwealth. Employment is the number one reason why people migrated into the CNMI. Seventy one percent (71%, 16,151) of all migrants came for employment purpose. Another 20% (4,601) came because they were spouse, dependent, or family member of an employed person.
POTENTIAL LABOR FORCE POPULATION BY MIGRATE REASON
Employment, as reason for migration, increased as a percentage of the potential labor force population when persons less than 16 years of age are excluded. It increased to 76% while spouse, dependent, and family member declined to 16%.
LABOR FORCE POPULATION BY MIGRATE REASON
When the labor force population and not in labor force population are separated, employment, as a reason for migration, increased to 86% of the labor force population while spouse, dependent, family member declined to 8%.
EMPLOYED POPULATION BY MIGRATE REASON
When the employed is separated from the unemployed population, not only that employment is the number one reason for migration, it becomes clear that employed migrants influences the composition of the other populations, namely the labor force population, potential labor force population and the ultimately the general population. That is, when migrant enters the CNMI for employment purpose, employment population increases, but also, the labor force population increases, the potential labor force population increases, and ultimately, the general population increases. Of course, the converse is true as well.
UNEMPLOYED POPULATION BY MIGRATE REASON
Among the migrant unemployed population, persons that came here for employment purposes make up 74%. Obviously, when migrants lose their jobs, for one reason or another, they initially came for employment reason and show up in a survey. It is important to note, again, that unemployed migrants are temporary residents and might remain in the Commonwealth, temporarily, when they lose their jobs, but eventually will leave the CNMI in time, according to the requirements of existing laws.
NOT IN LABOR FORCE POPULATION BY MIGRATE REASON
Employment, as reason for being in the CNMI, decline as a proportion (44%) of migrants in the not in labor force population. Like in the unemployed population, as pointed out previously, the presence of migrants in the not in labor force population is more temporary in duration since these persons will eventually leave the CNMI, according to the requirements of the laws.
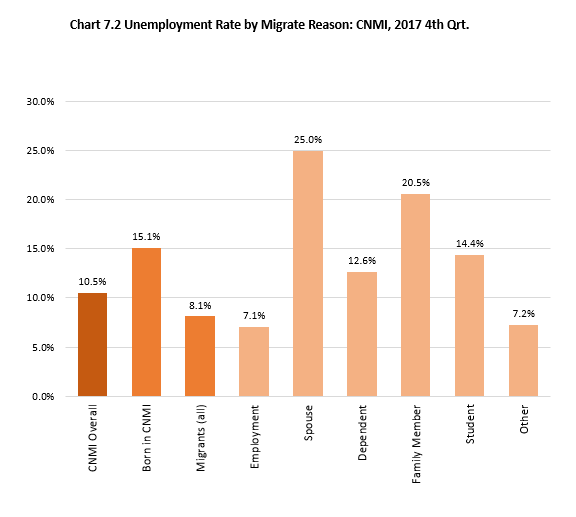
UNEMPLOYMENT RATE BY MIGRATE REASON
Unemployment rate was 8.1% for all migrants. It was lowest for migrants who came for employment reason and relatively high for the other migrant groups. Unemployment rate of the employment migrants is expected to be lower than the CNMI-born population because of their temporary residency.
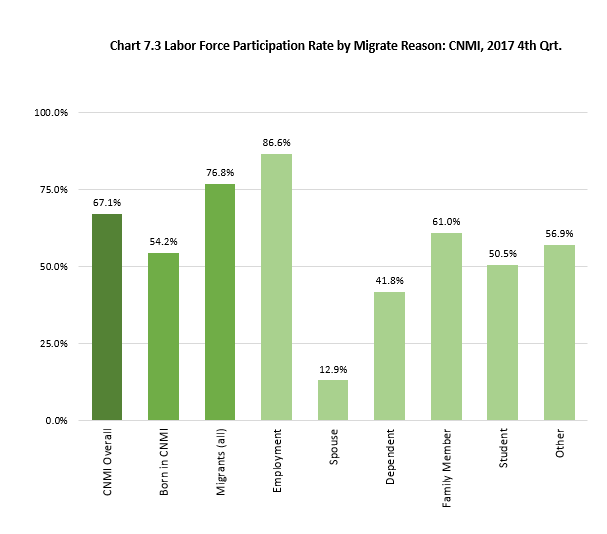
LABOR FORCE PARTICIPATION RATE BY MIGRATE REASON
Labor force participation rate which is 76.8% for the migrants was a high 86.6% for the employment migrants and relatively low for the other migrant groups. This is expected since this group came for employment in the first place.
LFP 2017 Table7.0-1
Labor Force Participation Measures by Migrate Reason: CNMI, 2017 4th Qtr.
| Reason | General Population | Potential Labor Force Population (persons 16+ years) | Labor Force Population | Employed Population | Unemployed Population | Not In Labor Force Population | Unemployment Rate | Labor Force Participation Rate |
|---|---|---|---|---|---|---|---|---|
| Source: LFP 2017 CNMI CSD | ||||||||
| Employment | 16,151 | 16,151 | 13,988 | 13,002 | 986 | 2,162 | 7.1 % | 86.6 % |
| Spouse of Employed | 916 | 916 | 118 | 89 | 30 | 797 | 25.0 % | 12.9 % |
| Dependent of Employed | 2,234 | 1,138 | 475 | 415 | 60 | 662 | 12.6 % | 41.8 % |
| Family Member of Employed | 1,452 | 1,292 | 788 | 627 | 162 | 504 | 20.5 % | 61.0 % |
| Student-Attend School | 529 | 529 | 267 | 228 | 38 | 262 | 14.4 % | 50.5 % |
| Other | 1,364 | 1,296 | 738 | 685 | 53 | 558 | 7.2 % | 56.9 % |
| (Born in CNMI) | 29,618 | 16,097 | 8,730 | 7,413 | 1,317 | 7,367 | 15.1 % | 54.2 % |
LFP 2017 Table7.0-2
Labor Force Participation Measures by Migrate Reason: CNMI, 2017 4th Qtr.T7.0-2.csv
| Reason | General Population | Potential Labor Force Population (persons 16+ years) | Labor Force Population | Employed Population | Un-employed Population | Not In Labor Force Population |
|---|---|---|---|---|---|---|
| Source: LFP 2017 CNMI CSD | ||||||
| Employment | 71.3% | 75.7% | 85.4% | 86.4% | 74.2% | 43.7% |
| Spouse of Employed | 4.0% | 4.3% | 0.7% | 0.6% | 2.2% | 16.1% |
| Dependent of Employed | 9.9% | 5.3% | 2.9% | 2.8% | 4.5% | 13.4% |
| Family Member of Employed | 6.4% | 6.1% | 4.8% | 4.2% | 12.2% | 10.2% |
| Student-Attend School | 2.3% | 2.5% | 1.6% | 1.5% | 2.9% | 5.3% |
| Other | 6.0% | 6.1% | 4.5% | 4.6% | 4.0% | 11.3% |
To download chart, right click on the chart and select “Save Image As”…