LFP HOUSING CHARACTERISTICS BY NUMBER OF BOAT
DescriptionTable DataCharts and Figures Data
CNMI Total
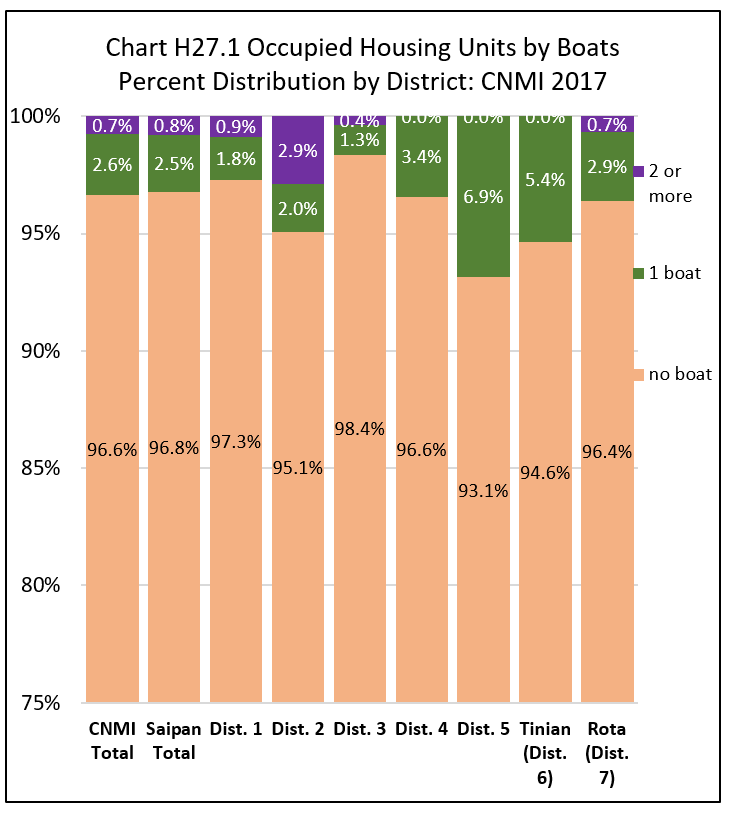
Units with a boat was only 3.4% of all occupied housing units in the CNMI in 2017 while units with no boat was 96.6%.
By Island
The percentage of units with a boat was slightly higher in Tinian (5.4%) than in Rota (3.6%) and in Saipan (3.2%).
By Saipan Districts
Within Saipan, the percentage of all occupied units with a boat was highest in Districts 5 (6.9%) and was lowest in District 3 (1.7%). See Chart H27.1 and Table H27.1 for detail.
Housing Characteristics
LFS 2017 Table H27.1
Labor Force Participation Measures
Table H27.1 Occupied Housing Units by Boat, by Island, and by District: CNMI, 2017 4th Qtr.
| Saipan District 1 |
Saipan District 2 |
Saipan District 3 |
Saipan District 4 |
Saipan District 5 |
Tinian District 6 |
Rota District 7 |
||
|---|---|---|---|---|---|---|---|---|
| Source: Labor Force Survey CNMI, 2017 4th Qtr. | ||||||||
| Boat | no boat | 4,215 | 1,950 | 5,432 | 1,083 | 1,880 | 851 | 737 |
| Boat | 1 boat | 79 | 42 | 71 | 38 | 139 | 48 | 22 |
| Boat | 2 or more | 38 | 59 | 19 | – | – | – | 5 |
| Percent within | no boat | 97.3% | 95.1% | 98.4% | 96.6% | 93.1% | 94.6% | 96.4% |
| Percent within | 1 boat | 1.8% | 2.0% | 1.3% | 3.4% | 6.9% | 5.4% | 2.9% |
| Percent within | 2 or more | 0.9% | 2.9% | 0.4% | 0.0% | 0.0% | 0.0% | 0.7% |
| Percent by | no boat | 26.1% | 12.1% | 33.6% | 6.7% | 11.6% | 5.3% | 4.6% |
| Percent by | 1 boat | 18.0% | 9.5% | 16.1% | 8.7% | 31.5% | 11.0% | 5.1% |
| Percent by | 2 or more | 31.3% | 48.6% | 15.9% | 0.0% | 0.0% | 0.0% | 4.2% |
Housing Characteristics
To download chart, right click on the chart and select “Save Image As”…