LFP HOUSING CHARACTERISTICS BY NUMBER OF VEHICLE
CNMI Total
The median number of vehicles was 1.0 and the mean was 1.2 in the CNMI in 2017. Units with 1 vehicle was 45.7% of all occupied housing units, units with 2 vehicles was 22.7%, units with 3 vehicles 6.4%, units with 4 or more vehicles was 2.5%, while units with no vehicles was 22.8%.
By Island
The median number of vehicles per occupied unit was 1.0 in all three islands while the mean was 1.2 in Saipan and 1.1 in both Tinian and Rota which means relatively more units in Saipan had more than 1 vehicle compared to Tinian and Rota. For example, as shown in Table H26.1, 2.7% of all occupied units had 4 or more vehicles in Saipan, compared to 1.1% in Tinian and zero in Rota.
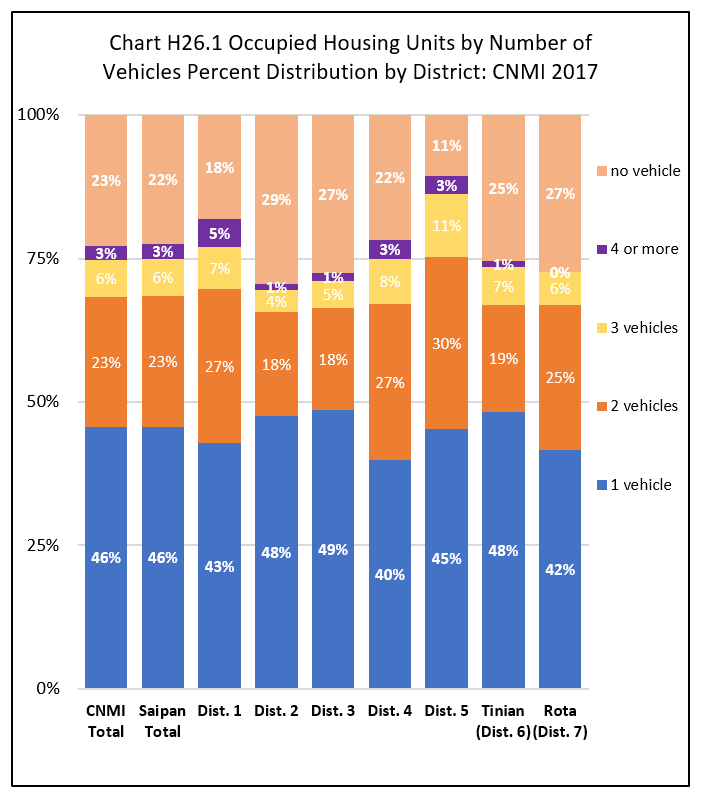
By Saipan Districts
Within Saipan, the mean number of vehicles per occupied units was highest in District 5 (1.5) and lowest in District 2 and 3 (both 1.0). This means more units in District 5 have more than 1 vehicle per unit than in Districts 2 and 3. As shown in Chart H26.1 and Table H26.1, the percentage of all units with 1 vehicle was highest in District 3 (48.6%) and lowest in District 4 (39.9%). The percentage of units with 2 vehicles was highest in District 5 (29.8%) and lowest in District 3 (18.1%). The percentage of units with 3 vehicles was highest in District 5 (11.0%) and lowest in District 2 (3.8%). The percentage of units with 4 or more vehicles was highest in District 1 (4.9%) and lowest in District 2 (1.0%). The percentage of units with no vehicles was highest in District 2 (29.4%) and lowest in District 5 (10.7%).
Housing Characteristics
LFS 2017 Table H26.1
Labor Force Participation Measures
Table H26.1 Occupied Housing Units by Vehicles, by Island, and by District: CNMI, 2017 4th Qtr.
| Saipan District 1 |
Saipan District 2 |
Saipan District 3 |
Saipan District 4 |
Saipan District 5 |
Tinian District 6 |
Rota District 7 |
||
|---|---|---|---|---|---|---|---|---|
| Source: Labor Force Survey CNMI, 2017 4th Qtr. | ||||||||
| Vehicles | no vehicle | 784 | 604 | 1,517 | 245 | 215 | 229 | 209 |
| Vehicles | 1 vehicle | 1,854 | 976 | 2,684 | 448 | 916 | 433 | 318 |
| Vehicles | 2 vehicles | 1,168 | 372 | 980 | 305 | 602 | 169 | 193 |
| Vehicles | 3 vehicles | 313 | 79 | 262 | 88 | 222 | 59 | 44 |
| Vehicles | 4 or more | 213 | 21 | 79 | 36 | 63 | 10 | – |
| Percent within | no vehicle | 18.1% | 29.4% | 27.5% | 21.8% | 10.7% | 25.4% | 27.4% |
| Percent within | 1 vehicle | 42.8% | 47.6% | 48.6% | 39.9% | 45.4% | 48.2% | 41.7% |
| Percent within | 2 vehicles | 27.0% | 18.1% | 17.8% | 27.2% | 29.8% | 18.7% | 25.2% |
| Percent within | 3 vehicles | 7.2% | 3.8% | 4.7% | 7.9% | 11.0% | 6.6% | 5.7% |
| Percent within | 4 or more | 4.9% | 1.0% | 1.4% | 3.2% | 3.1% | 1.1% | 0.0% |
| Percent by | no vehicle | 20.6% | 15.9% | 39.9% | 6.4% | 5.7% | 6.0% | 5.5% |
| Percent by | 1 vehicle | 24.3% | 12.8% | 35.2% | 5.9% | 12.0% | 5.7% | 4.2% |
| Percent by | 2 vehicles | 30.8% | 9.8% | 25.9% | 8.0% | 15.9% | 4.4% | 5.1% |
| Percent by | 3 vehicles | 29.4% | 7.4% | 24.6% | 8.3% | 20.8% | 5.5% | 4.1% |
| Percent by | 4 or more | 50.4% | 5.0% | 18.7% | 8.6% | 15.0% | 2.3% | 0.0% |
Housing Characteristics
To download chart, right click on the chart and select “Save Image As”…