LFP HOUSING CHARACTERISTICS BY PUBLIC UTILITY WATER
DescriptionTable DataCharts and Figures Data
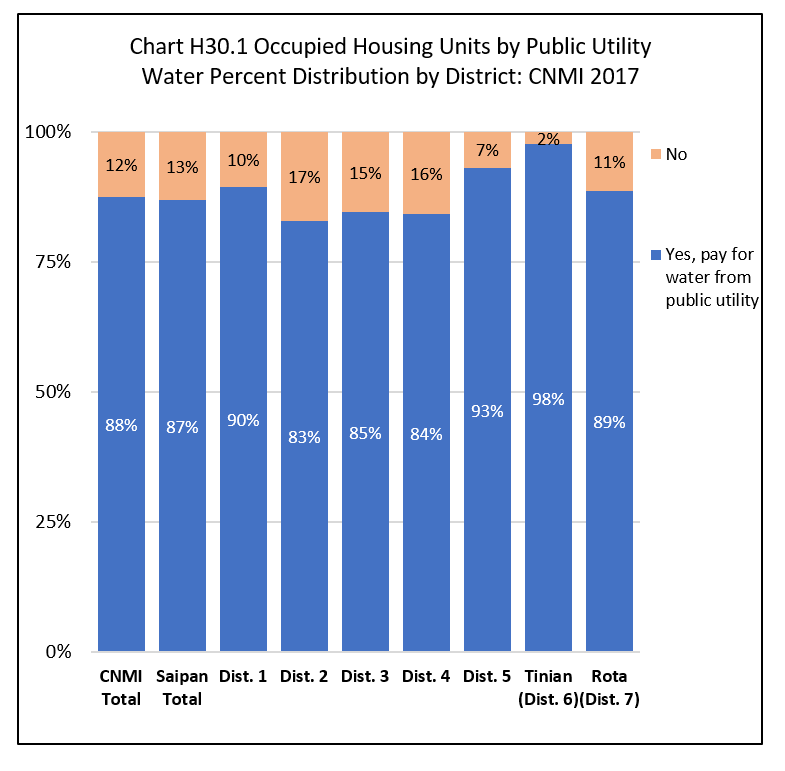
CNMI Total
Units that paid for water from public utility was 87.6% of all occupied housing units in the CNMI in 2017 while units that did not pay for water from a public utility was 12.4%.
By Island
The percentage of occupied units that paid for water from public utility was highest in Tinian (97.7%), followed by Rota (88.6%) and then Saipan (86.9%).
By Saipan Districts
Within Saipan, the percentage of all occupied units that paid for water from a public utility was highest in Districts 5 (93.2%) and was lowest in District 2 (82.9%).
Housing Characteristics
LFS 2017 Table H30.1
Labor Force Participation Measures
Table H30.1 Occupied Housing Units by Public Utility Water, by Island, and by District: CNMI, 2017 4th Qtr.
| Saipan District 1 |
Saipan District 2 |
Saipan District 3 |
Saipan District 4 |
Saipan District 5 |
Tinian District 6 |
Rota District 7 |
||
|---|---|---|---|---|---|---|---|---|
| Source: Labor Force Survey CNMI, 2017 4th Qtr. | ||||||||
| Public Utility Water | Yes, pay for water from public utility | 3,877 | 1,700 | 4,674 | 944 | 1,880 | 878 | 677 |
| Public Utility Water | No | 455 | 351 | 848 | 177 | 138 | 21 | 87 |
| Percent within | Yes, pay for water from public utility | 89.5% | 82.9% | 84.6% | 84.2% | 93.2% | 97.7% | 88.6% |
| Percent within | No | 10.5% | 17.1% | 15.4% | 15.8% | 6.8% | 2.3% | 11.4% |
| Percent by | Yes, pay for water from public utility | 26.5% | 11.6% | 31.9% | 6.5% | 12.9% | 6.0% | 4.6% |
| Percent by | No | 21.9% | 16.9% | 40.8% | 8.5% | 6.7% | 1.0% | 4.2% |
Housing Characteristics
To download chart, right click on the chart and select “Save Image As”…