LFP HOUSING CHARACTERISTICS BY PURCHASING DRINKING WATER
DescriptionTable DataCharts and Figures Data
CNMI Total
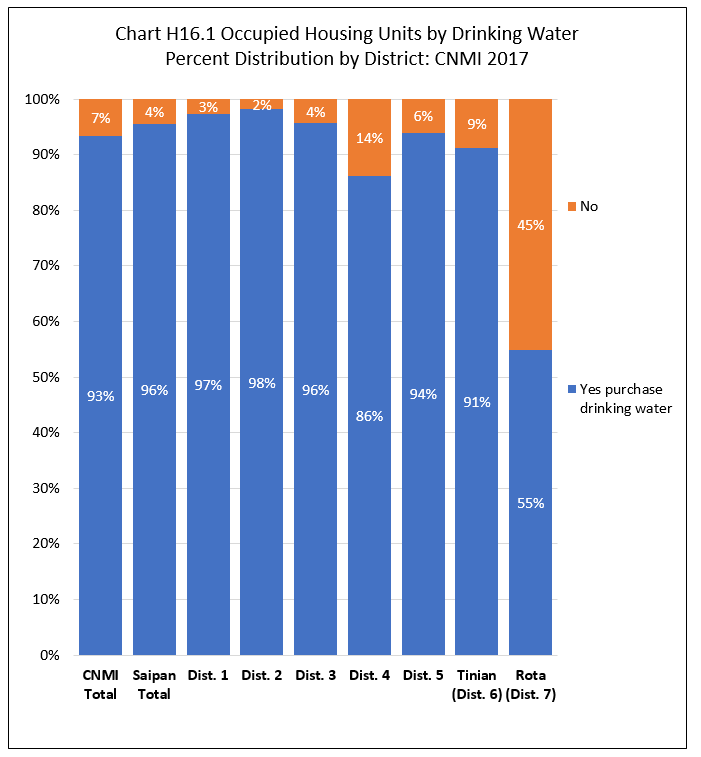
Units that purchased drinking water was 93.4% of all occupied housing units in the CNMI in 2017 while units that did not purchase drinking water was 6.6%.
By Island
The percentage of occupied units that purchased drinking water was highest in Saipan (95.5%), followed by Tinian (91.2%) and lowest in Rota (54.8%).
By Saipan Districts
Within Saipan, the percentage of all units that purchased drinking water was highest in District 2 (98.1%), and lowest in District 4 (86.2%). See Chart H16.1 and Table H16.1 for detail.
Housing Characteristics
LFS 2017 Table H16.1
Labor Force Participation Measures
Table H16.1 Occupied Housing Units by Drinking Water, by Island, and by District: CNMI, 2017 4th Qtr.
| Saipan District 1 |
Saipan District 2 |
Saipan District 3 |
Saipan District 4 |
Saipan District 5 |
Tinian District 6 |
Rota District 7 |
||
|---|---|---|---|---|---|---|---|---|
| Source: Labor Force Survey CNMI, 2017 4th Qtr. | ||||||||
| Drinking Water | Yes purchase drinking water | 4,214 | 2,012 | 5,282 | 966 | 1,897 | 820 | 419 |
| Drinking Water | No | 118 | 38 | 240 | 155 | 122 | 79 | 345 |
| Percent within | Yes purchase drinking water | 97.3% | 98.1% | 95.6% | 86.2% | 94.0% | 91.2% | 54.8% |
| Percent within | No | 2.7% | 1.9% | 4.4% | 13.8% | 6.0% | 8.8% | 45.2% |
| Percent by | Yes purchase drinking water | 27.0% | 12.9% | 33.8% | 6.2% | 12.2% | 5.3% | 2.7% |
| Percent by | No | 10.7% | 3.5% | 21.9% | 14.1% | 11.1% | 7.2% | 31.5% |
Housing Characteristics
To download chart, right click on the chart and select “Save Image As”…