LFP HOUSING CHARACTERISTICS BY RADIO
CNMI Total
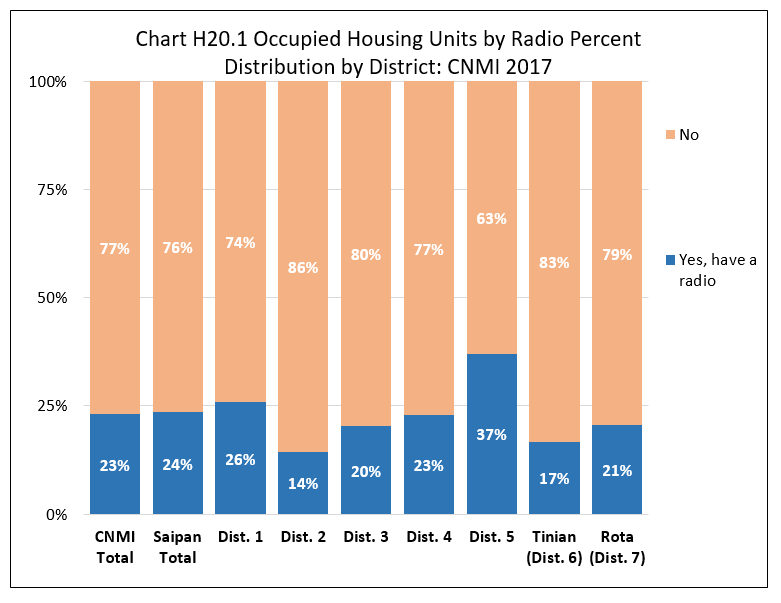
Units with a radio was 23.1% of all occupied housing units in the CNMI in 2017 while units with no radio was 76.9%.
By Island
The percentage of occupied units with a radio at home was relatively higher in Saipan (23.6%), followed by Rota (20.5%), then Tinian (16.7%). Conversely, the percentage of units without a radio at home was highest in Tinian (83.3%), followed by Rota (79.5%), then Saipan (76.4%).
By Saipan Districts
Within Saipan, the percentage of all units with a radio was highest in Districts 5 (37.1%) and was lowest in District 2 (14.4%). See Chart H20.1 and Table H20.1 for detail.
Housing Characteristics
LFS 2017 Table H20.1
Labor Force Participation Measures
Table H20.1 Occupied Housing Units by Radio, by Island, and by District: CNMI, 2017 4th Qtr.
| Saipan District 1 |
Saipan District 2 |
Saipan District 3 |
Saipan District 4 |
Saipan District 5 |
Tinian District 6 |
Rota District 7 |
||
|---|---|---|---|---|---|---|---|---|
| Source: Labor Force Survey CNMI, 2017 4th Qtr. | ||||||||
| Radio | Yes, have a radio | 1,122 | 295 | 1,123 | 257 | 748 | 150 | 157 |
| Radio | No | 3,210 | 1,756 | 4,399 | 864 | 1,270 | 749 | 608 |
| Percent within | Yes, have a radio | 25.9% | 14.4% | 20.3% | 22.9% | 37.1% | 16.7% | 20.5% |
| Percent within | No | 74.1% | 85.6% | 79.7% | 77.1% | 62.9% | 83.3% | 79.5% |
| Percent by | Yes, have a radio | 29.1% | 7.7% | 29.1% | 6.7% | 19.4% | 3.9% | 4.1% |
| Percent by | No | 25.0% | 13.7% | 34.2% | 6.7% | 9.9% | 5.8% | 4.7% |
Housing Characteristics
To download chart, right click on the chart and select “Save Image As”…