LFP HOUSING CHARACTERISTICS BY RENT AMOUNT
CNMI Total
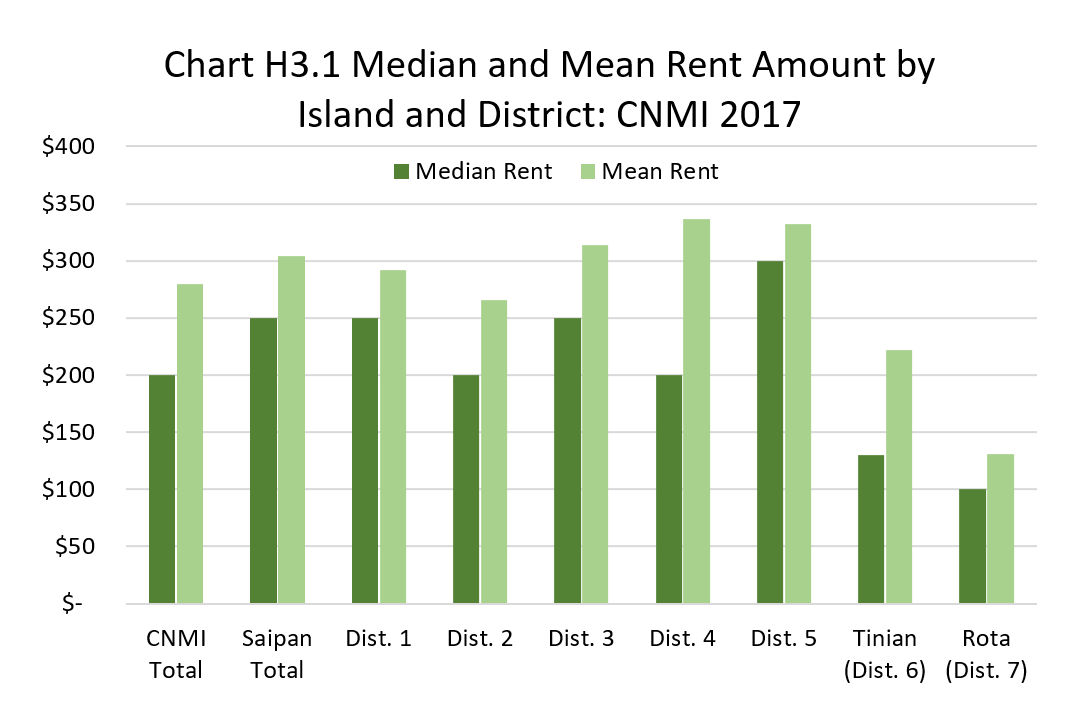
The median rent was $200 and mean rent was $280, in the CNMI in 2017.
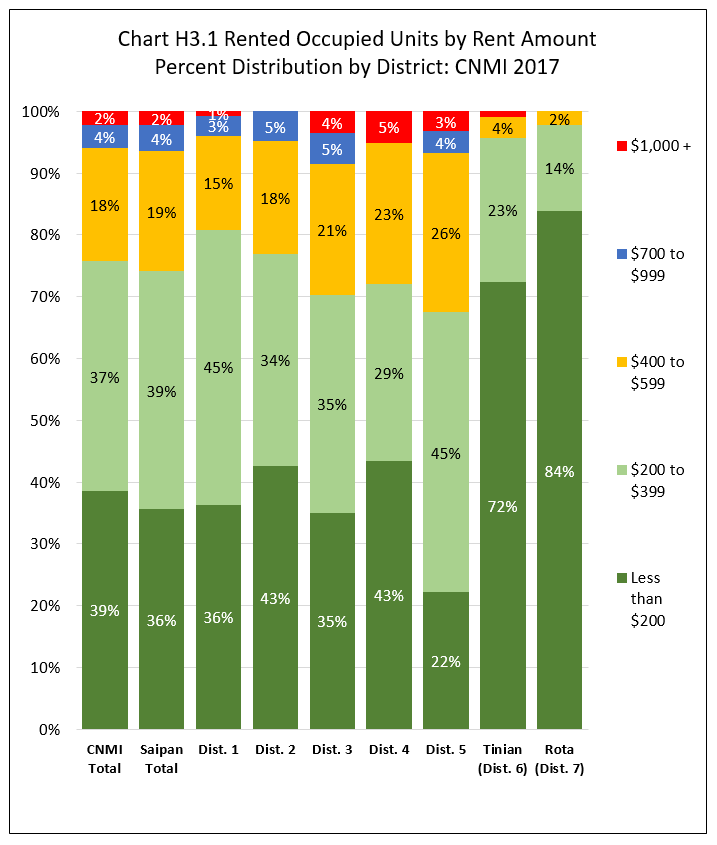
Units with cash rent of less than $200 was 39% of all rented for cash housing units in the CNMI in 2017; units with cash rent between $200 and $399 was 37%; units with cash rent between $400 and $599 was 18%; units with cash rent between $700 and $999 was 4% and units with cash rent of $1,000 or more was 2%.
By Island
Median and mean rent amounts were higher in Saipan, $250 and $304, respectively; followed by Tinian, $130 and $222, respectively; and were lowest in Rota, $100 and $131, respectively.
The percentage of all units with cash rent less than $200 was highest in Rota (83.8%); followed by Tinian 72.4%, and lowest in Saipan (35.6%). The percentage of units with cash rent between $200 and $399 was highest in Saipan (38.5%), followed by Tinian (23.2%) and lowest in Rota (14.0%). The percentage of units with cash rent $400 or more was relatively high in Saipan (26.0%) and low in Tinian (4.4%) and Rota (2.2%).
By Saipan Districts
Median rent was highest in District 5 ($300), followed by Districts 1 and 3 ($250) and lower in Districts 2 and 4 ($200). Mean rent amount was highest in District 4 ($337), followed by District 5 ($332), District 3 ($313), District 1 ($292), and lowest in District 2 ($266).
Within Saipan, percentage of units with cash rent less than $200 was highest in District 4 (43.5%), followed by District 2 (42.6%), District 1 (35.6%%) and District 3 (35.0%); and lowest in District 5 (22.2%). Percentage of units with cash rent between $200 and $399 was highest in District 5 (45.3%), followed by District 1 (44.5%), District 3 (35.3%%), District 2 (34.4%) and lowest in District 4 (28.6%). Percentage of units with cash rent between $400 and $699 was highest in District 5 (25.7%), followed by District 4 (22.9%), District 3 (21.2%), District 2 (18.1%); and lowest in District 1 (15.1%). Percentage of units with cash rent between $700 and $999 was highest in District 3 (5.0%), followed by District 2 (4.9%), District 5 (3.6%) and District 1 (3.2%). Percentage of units with cash rent of $1,000 and above was highest in District 4 (5.1%), followed by District 3 (3.5%), District 5 (3.2%) and District (0.8%). See Chart H3.1 and Table H3.1 for detail.
Housing Characteristics
LFS 2017 Table H3.1
Labor Force Participation Measures
Table H.3.1 Rented Occupied Housing Units by Rent Amount, by Island, and by District: CNMI, 2017 4th Qtr.
| Saipan District 1 |
Saipan District 2 |
Saipan District 3 |
Saipan District 4 |
Saipan District 5 |
Tinian District 6 |
Rota District 7 |
||
|---|---|---|---|---|---|---|---|---|
| Source: Labor Force Survey CNMI, 2017 4th Qtr. | ||||||||
| Rent Amount | Less than $200 | 891 | 504 | 1,302 | 137 | 177 | 316 | 196 |
| Rent Amount | $200 to $399 | 1,091 | 407 | 1,312 | 90 | 362 | 101 | 33 |
| Rent Amount | $400 to $599 | 371 | 215 | 788 | 72 | 206 | 15 | 5 |
| Rent Amount | $700 to $999 | 79 | 58 | 187 | – | 28 | – | – |
| Rent Amount | $1,000 + | 19 | – | 130 | 16 | 26 | 4 | – |
| Rent Amount | Mean Rent | $292 | $266 | $313 | $337 | $332 | $222 | $131 |
| Rent Amount | Median Rent | $250 | $200 | $250 | $200 | $300 | $130 | $100 |
| Percent within | Less than $200 | 36.4% | 42.6% | 35.0% | 43.5% | 22.2% | 72.4% | 83.8% |
| Percent within | $200 to $399 | 44.5% | 34.4% | 35.3% | 28.6% | 45.3% | 23.2% | 14.0% |
| Percent within | $400 to $599 | 15.1% | 18.1% | 21.2% | 22.9% | 25.7% | 3.5% | 2.2% |
| Percent within | $700 to $999 | 3.2% | 4.9% | 5.0% | 0.0% | 3.6% | 0.0% | 0.0% |
| Percent within | $1,000 + | 0.8% | 0.0% | 3.5% | 5.1% | 3.2% | 0.9% | 0.0% |
| Percent by | Less than $200 | 25.3% | 14.3% | 36.9% | 3.9% | 5.0% | 9.0% | 5.6% |
| Percent by | $200 to $399 | 32.1% | 12.0% | 38.6% | 2.6% | 10.7% | 3.0% | 1.0% |
| Percent by | $400 to $599 | 22.2% | 12.8% | 47.1% | 4.3% | 12.3% | 0.9% | 0.3% |
| Percent by | $700 to $999 | 22.5% | 16.4% | 53.1% | 0.0% | 8.1% | 0.0% | 0.0% |
| Percent by | $1,000 + | 9.7% | 0.0% | 66.9% | 8.2% | 13.3% | 2.0% | 0.0% |
Housing Characteristics
To download, right click on the chart and select “Save Image As”…