LFP HOUSING CHARACTERISTICS BY SEWER CONNECTION
CNMI Total
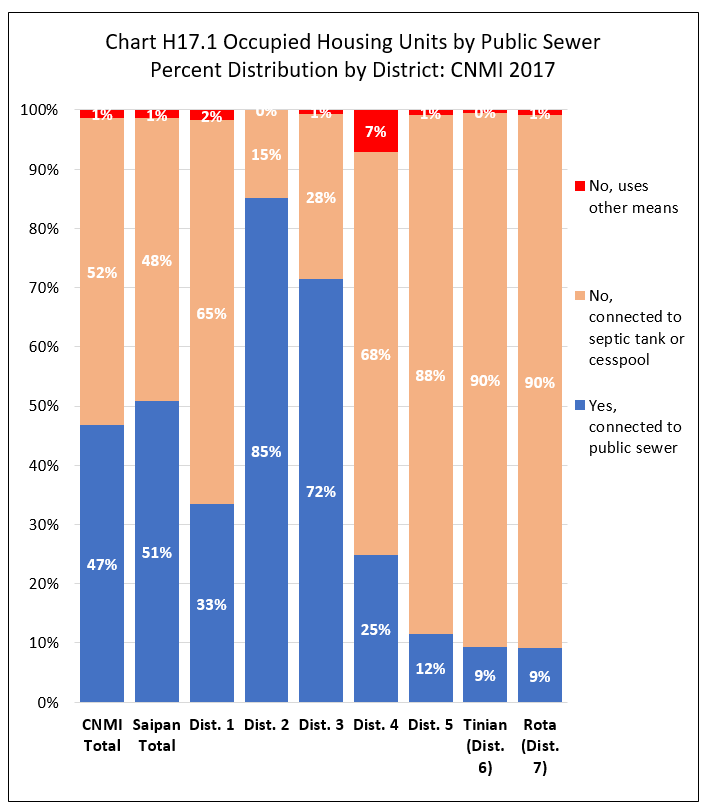
Units connected to public sewer was 46.7% of all occupied housing units in the CNMI in 2017; units connected to septic tank or cesspool was 51.9%; while units using other means was 1.3%.
By Island
The percentage of occupied units connected to public sewer higher in Saipan (50.9%) and lower in Tinian (9.3%) and Rota (9.1%). The percentage of occupied units connected to septic tank or cesspool was higher in Tinian (90.3%) and Rota (90.1%) and lower in Saipan (48%).
By Saipan Districts
Within Saipan, the percentage of all occupied units connected to public sewer was highest in District 2 (85.1%), followed by District 3 (71.5%), lower in District 1 (33.4%) and District 4 (24.9%) and lowest in District 5 (11.5%). The percentage of all occupied units connected to septic tank or cesspool was highest in District 5 (87.5%) and lowest in District 2 (14.9%). See Chart H17.1 and Table H17.1 for detail.
Housing Characteristics
LFS 2017 Table H17.1
Labor Force Participation Measures
Table H17.1 Occupied Housing Units by Public Sewer, by Island, and by District: CNMI, 2017 4th Qtr.
| Saipan District 1 |
Saipan District 2 |
Saipan District 3 |
Saipan District 4 |
Saipan District 5 |
Tinian District 6 |
Rota District 7 |
||
|---|---|---|---|---|---|---|---|---|
| Source: Labor Force Survey CNMI, 2017 4th Qtr. | ||||||||
| Public Sewer Connection | Yes, connected to public sewer | 1,448 | 1,745 | 3,950 | 279 | 233 | 84 | 69 |
| Public Sewer Connection | No, connected to septic tank or cesspool | 2,807 | 305 | 1,533 | 763 | 1,767 | 811 | 689 |
| Public Sewer Connection | No, uses other means | 76 | – | 40 | 79 | 19 | 4 | 6 |
| Percent within | Yes, connected to public sewer | 33.4% | 85.1% | 71.5% | 24.9% | 11.5% | 9.3% | 9.1% |
| Percent within | No, connected to septic tank or cesspool | 64.8% | 14.9% | 27.8% | 68.0% | 87.5% | 90.3% | 90.1% |
| Percent within | No, uses other means | 1.8% | 0.0% | 0.7% | 7.1% | 0.9% | 0.4% | 0.8% |
| Percent by | Yes, connected to public sewer | 18.5% | 22.4% | 50.6% | 3.6% | 3.0% | 1.1% | 0.9% |
| Percent by | No, connected to septic tank or cesspool | 32.4% | 3.5% | 17.7% | 8.8% | 20.4% | 9.4% | 7.9% |
| Percent by | No, uses other means | 34.1% | 0.0% | 17.7% | 35.4% | 8.4% | 1.7% | 2.7% |
Housing Characteristics
To download chart, right click on the chart and select “Save Image As”…