LFP HOUSING CHARACTERISTICS BY WATER SOURCE
CNMI Total
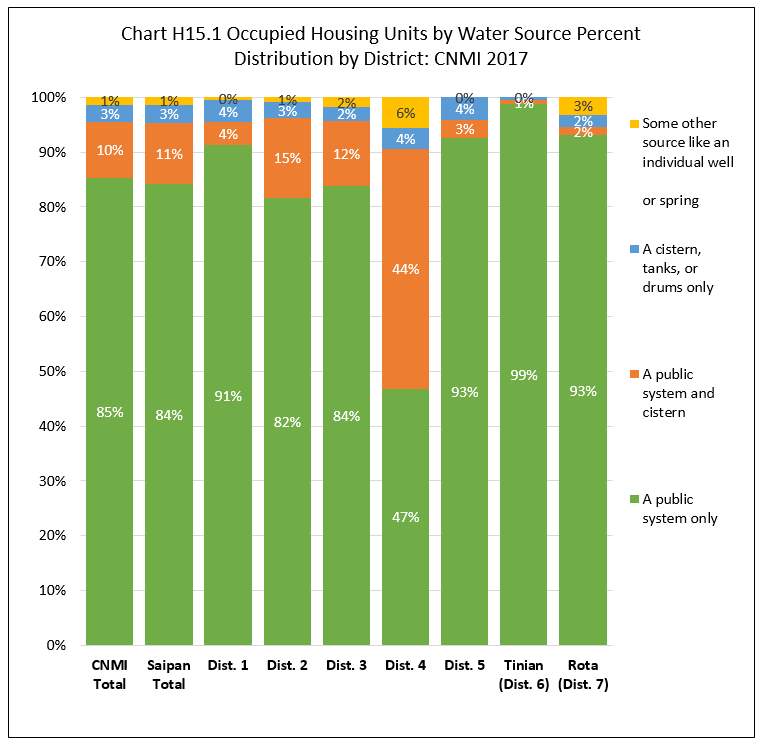
Units getting water from a public system only was 85.3% of all occupied housing units in the CNMI in 2017; units getting water from a public system and cistern was 10.2%; units getting water from a cistern, tank or drums only was 3.1%, units getting water from other means was only 1.3%.
By Island
The percentage of units getting water from a public system only was highest in Tinian (98.7%), followed by Rota (93.1%), then Saipan (84.1%). The percentage getting water from both public system and cistern was relatively high in Saipan (11.2%) and lower in Rota (1.6%) and Tinian (0.9%). The percentage getting water from a cistern, tanks or drums only was relatively low: 3.3% in Saipan, 2.2% in Rota, and .04% in Tinian.
By Saipan Districts
Within Saipan, the percentage of all units getting water from a public system only was highest in District 5 (92.7%) and lowest in District 4 (46.7%). The percentage getting water from a public system and cistern was highest in District 4 (43.7%) and lowest in District 5 (3.3%). See Chart H15.1 and Table H15.1 for detail.
Housing Characteristics
LFS 2017 Table H15.1
Labor Force Participation Measures
Table H15.1 Occupied Housing Units by Water Source, by Island, and by District: CNMI, 2017 4th Qtr.
| Saipan District 1 |
Saipan District 2 |
Saipan District 3 |
Saipan District 4 |
Saipan District 5 |
Tinian District 6 |
Rota District 7 |
||
|---|---|---|---|---|---|---|---|---|
| Source: Labor Force Survey CNMI, 2017 4th Qtr. | ||||||||
| Water Source | A public system only | 3,956 | 1,676 | 4,629 | 526 | 1,870 | 887 | 711 |
| Water Source | A public system and cistern | 177 | 298 | 656 | 490 | 66 | 8 | 12 |
| Water Source | A cistern, tanks, or drums only | 180 | 58 | 138 | 44 | 83 | 4 | 17 |
| Water Source | Some other source like an individual well or spring |
19 | 19 | 99 | 62 | – | – | 24 |
| Percent within | A public system only | 91.3% | 81.7% | 83.8% | 46.9% | 92.7% | 98.7% | 93.1% |
| Percent within | A public system and cistern | 4.1% | 14.6% | 11.9% | 43.7% | 3.3% | 0.9% | 1.6% |
| Percent within | A cistern, tanks, or drums only | 4.1% | 2.8% | 2.5% | 3.9% | 4.1% | 0.4% | 2.2% |
| Percent within | Some other source like an individual well or spring |
0.4% | 0.9% | 1.8% | 5.5% | 0.0% | 0.0% | 3.1% |
| Percent by | A public system only | 27.8% | 11.8% | 32.5% | 3.7% | 13.1% | 6.2% | 5.0% |
| Percent by | A public system and cistern | 10.4% | 17.5% | 38.4% | 28.7% | 3.8% | 0.5% | 0.7% |
| Percent by | A cistern, tanks, or drums only | 34.4% | 11.0% | 26.4% | 8.3% | 15.8% | 0.7% | 3.3% |
| Percent by | Some other source like an individual well or spring |
8.6% | 8.6% | 44.2% | 27.8% | 0.0% | 0.0% | 10.8% |
Housing Characteristics
To download chart, right click on the chart and select “Save Image As”…