Labor Force Participation Survey 2017 Population Characteristics
CNMI Total
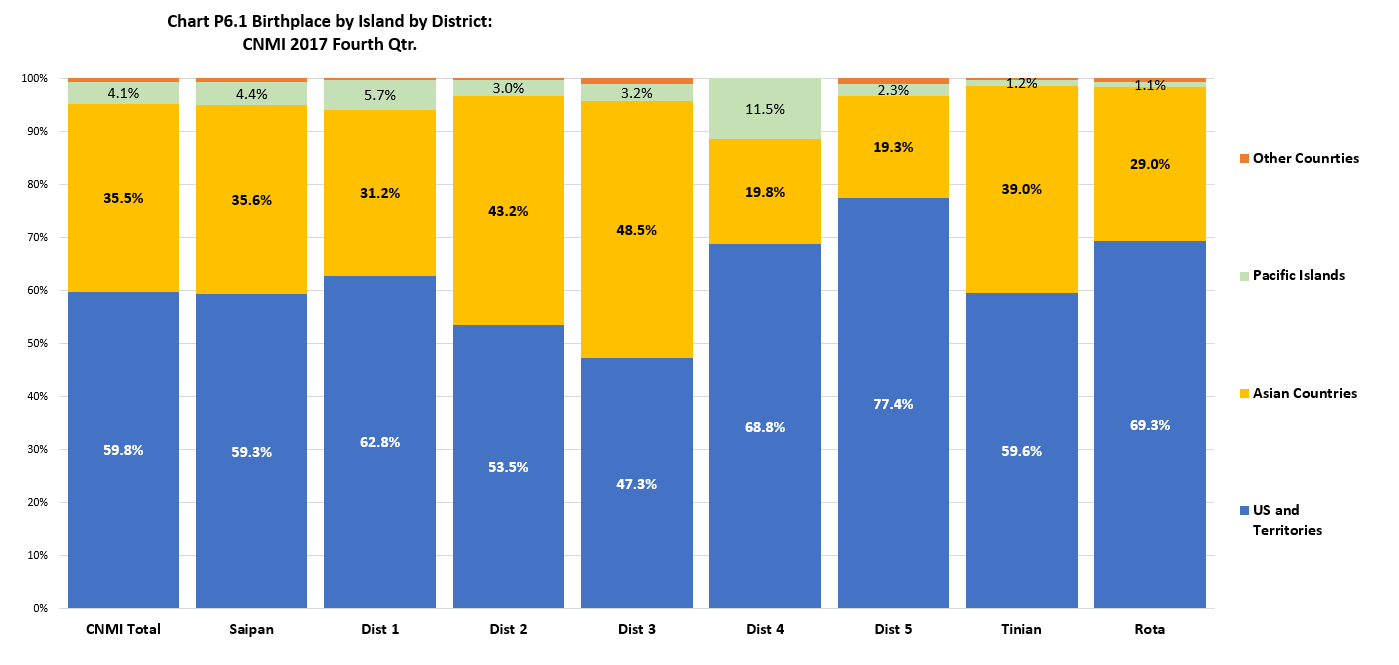
Born in the U.S. and territories was the largest percentage (59.8%) of the total population in the CNMI in 2017; followed by born in Asian countries (35.5%), while born in other Pacific Islands and in other countries made up only 4.7% of the total population. The percentage born in the CNMI was 56.7% of the total CNMI population while percentage born in the Philippines was 26.1%.
By Island
The percentage born in the CNMI was higher in Rota (60.7%) than in Saipan (56.6%) and in Tinian (55.1%). Born in the Philippines was higher in Tinian (30.1%) than in Saipan (26.1%) and in Rota (22.7%).
By Saipan Districts
The percentage born in the CNMI was highest in District 5 (70.6%) and lowest in District 3 (45.5%). Born in the Philippines percentage was highest in District 3 (34.0%) and lowest in District 5 (15.7%). Born in the Pacific Islands percentage was relatively higher in District 4 (11.5%) and lower in District 5 (2.3%).
Population Characteristics
LFS 2017 Table P6.1 Birthpalce by Island and by District: CNMI 2017 Fourth Qtr.
| Birthplace | CNMI Total |
Saipan Total |
Saipan Dist. 1 |
Saipan Dist. 2 |
Saipan Dist. 3 |
Saipan Dist. 4 |
Saipan Dist. 5 |
Tinian Dist. 6 |
Rota Dist. 7 |
|---|---|---|---|---|---|---|---|---|---|
| Source: Labor Force Survey CNMI, 2017 4th Qrt. | |||||||||
| CNMI | 29,618 | 26,914 | 8,674 | 3,456 | 6,931 | 2,580 | 5,273 | 1,446 | 1,258 |
| US and Territories | 1,611 | 1,312 | 383 | 59 | 261 | 96 | 512 | 119 | 179 |
| Pacific Islands | 2,167 | 2,113 | 816 | 197 | 484 | 447 | 169 | 31 | 23 |
| Phillippines | 13,661 | 12,399 | 3,321 | 2,096 | 5,167 | 645 | 1,170 | 791 | 471 |
| Other Asian Countries | 4,891 | 4,528 | 1,182 | 738 | 2,209 | 124 | 273 | 234 | 130 |
| Other Counrties | 316 | 298 | 38 | 19 | 166 | – | 74 | 6 | 12 |
LFS 2017 Table P6.1 Birthpalce by Island and by District: CNMI 2017 Fourth Qtr. (Distribution Within)
| Birthplace | CNMI Total |
Saipan Total |
Saipan Dist. 1 |
Saipan Dist. 2 |
Saipan Dist. 3 |
Saipan Dist. 4 |
Saipan Dist. 5 |
Tinian Dist. 6 |
Rota Dist. 7 |
|---|---|---|---|---|---|---|---|---|---|
| Source: Labor Force Survey CNMI, 2017 4th Qrt. | |||||||||
| CNMI | 56.70% | 56.60% | 60.20% | 52.60% | 45.50% | 66.30% | 70.60% | 55.10% | 60.70% |
| US and Territories | 3.10% | 2.80% | 2.70% | 0.90% | 1.70% | 2.50% | 6.90% | 4.50% | 8.60% |
| Pacific Islands | 4.10% | 4.40% | 5.70% | 3.00% | 3.20% | 11.50% | 2.30% | 1.20% | 1.10% |
| Phillippines | 26.10% | 26.10% | 23.00% | 31.90% | 34.00% | 16.60% | 15.70% | 30.10% | 22.70% |
| Other Asian Countries | 9.40% | 9.50% | 8.20% | 11.20% | 14.50% | 3.20% | 3.70% | 8.90% | 6.30% |
| Other Counrties | 0.60% | 0.60% | 0.30% | 0.30% | 1.10% | 0.00% | 1.00% | 0.20% | 0.60% |
LFS 2017 Table P6.1 Birthpalce by Island and by District: CNMI 2017 Fourth Qtr. (Distribution Amoung)
| Birthplace | CNMI Total |
Saipan Total |
Saipan Dist. 1 |
Saipan Dist. 2 |
Saipan Dist. 3 |
Saipan Dist. 4 |
Saipan Dist. 5 |
Tinian Dist. 6 |
Rota Dist. 7 |
|---|---|---|---|---|---|---|---|---|---|
| Source: Labor Force Survey CNMI, 2017 4th Qrt. | |||||||||
| CNMI | 100% | 90.90% | 29.30% | 11.70% | 23.40% | 8.70% | 17.80% | 4.90% | 4.20% |
| US and Territories | 100% | 81.50% | 23.80% | 3.70% | 16.20% | 6.00% | 31.80% | 7.40% | 11.10% |
| Pacific Islands | 100% | 97.50% | 37.70% | 9.10% | 22.30% | 20.60% | 7.80% | 1.40% | 1.10% |
| Phillippines | 100% | 90.80% | 24.30% | 15.30% | 37.80% | 4.70% | 8.60% | 5.80% | 3.40% |
| Other Asian Countries | 100% | 92.60% | 24.20% | 15.10% | 45.20% | 2.50% | 5.60% | 4.80% | 2.60% |
| Other Counrties | 100% | 94.40% | 12.00% | 6.10% | 52.70% | 0.00% | 23.60% | 1.80% | 3.80% |
Population Characteristics
To download, right click on the chart and select “Save Image As”…