CNMI Total
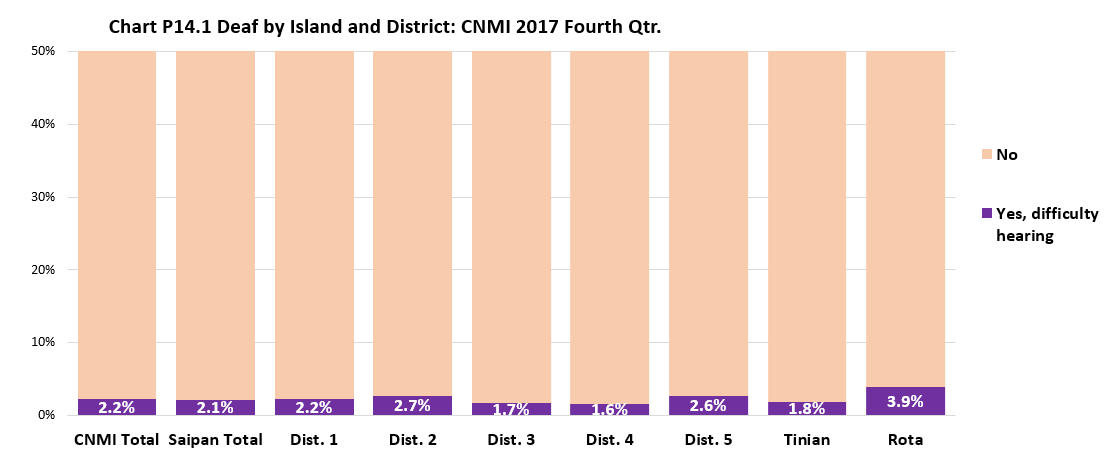
Persons with difficulty hearing (deaf) was 2.2% of the CNMI population in 2017.
By Island
The deaf percentage was higher in Rota (3.9%) than in Saipan (2.1%) and in Tinian (1.8%).
By Saipan Districts
The deaf percentage was highest in District 2 (2.7%) and lowest in District 4 (1.6%).
CNMI Total
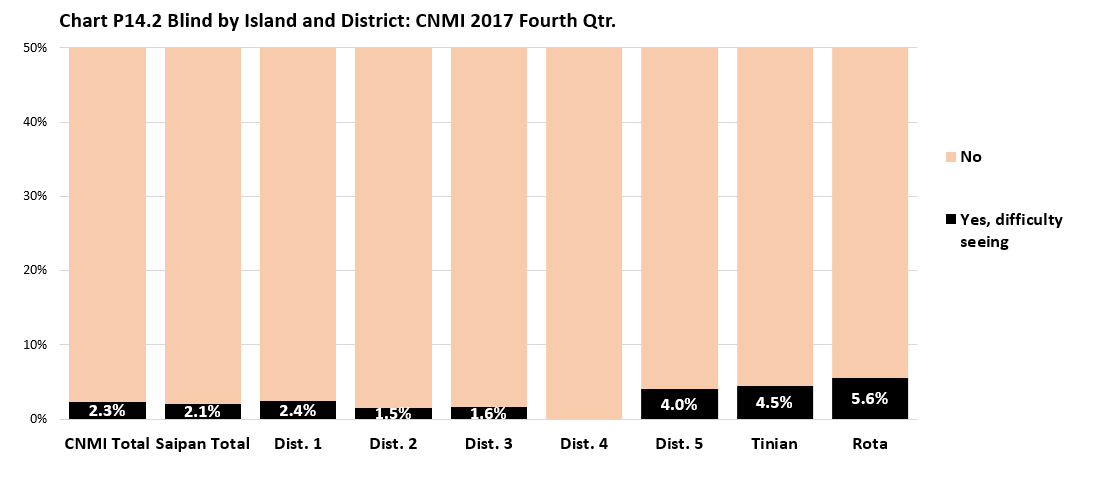
Persons with difficulty seeing (blind) was 2.3% of the CNMI’s population in 2017.
By Island
The blind percentage was higher in Rota (5.6%) than in Tinian (4.5%) and in Saipan (2.1%).
By Saipan Districts
The blind percentage was highest in District 5 (4.0%) and lowest in District 4.
CNMI Total
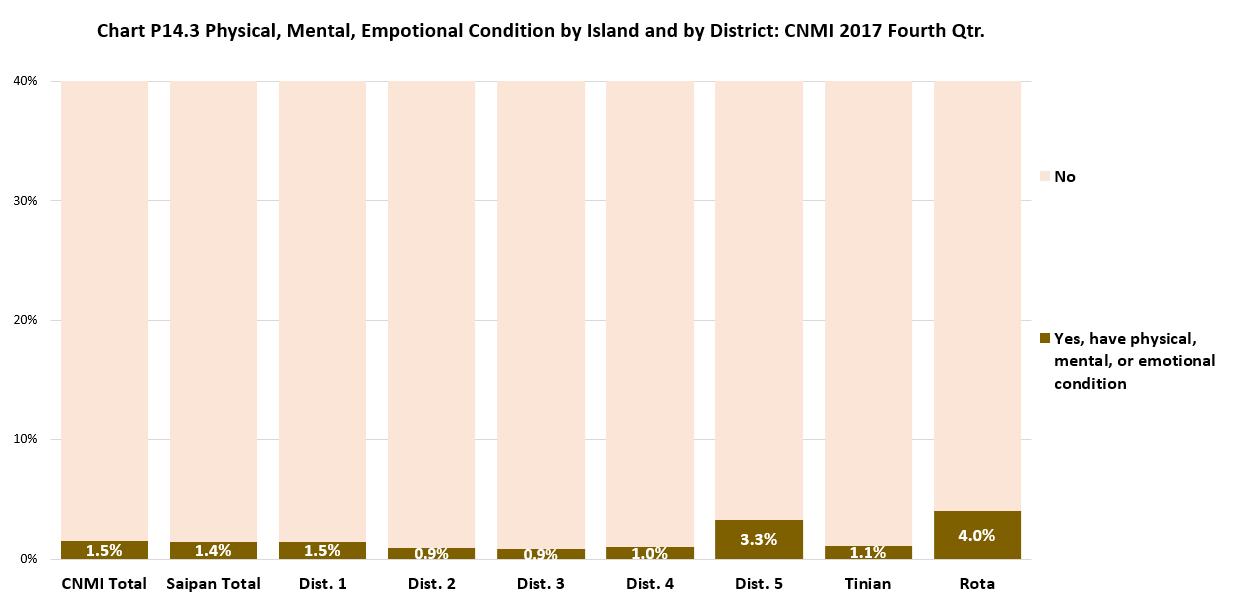
Persons with a physical, mental, or emotional condition causing serious difficulty concentrating, remembering, or making decisions was 1.5% of the CNMI’s population in 2017.
By Island
The percentage of population with a physical, mental, or emotional condition causing serious difficulty concentrating, remembering, or making decisions was higher in Rota (4.0%) than in Saipan (1.4%) and in Tinian (1.1%).
By Saipan Districts
The percentage of population with a physical, mental, or emotional condition causing serious difficulty concentrating, remembering, or making decisions was highest in District 5 (3.3%) and lowest in District 2 and 3 (both 0.9%).
CNMI Total
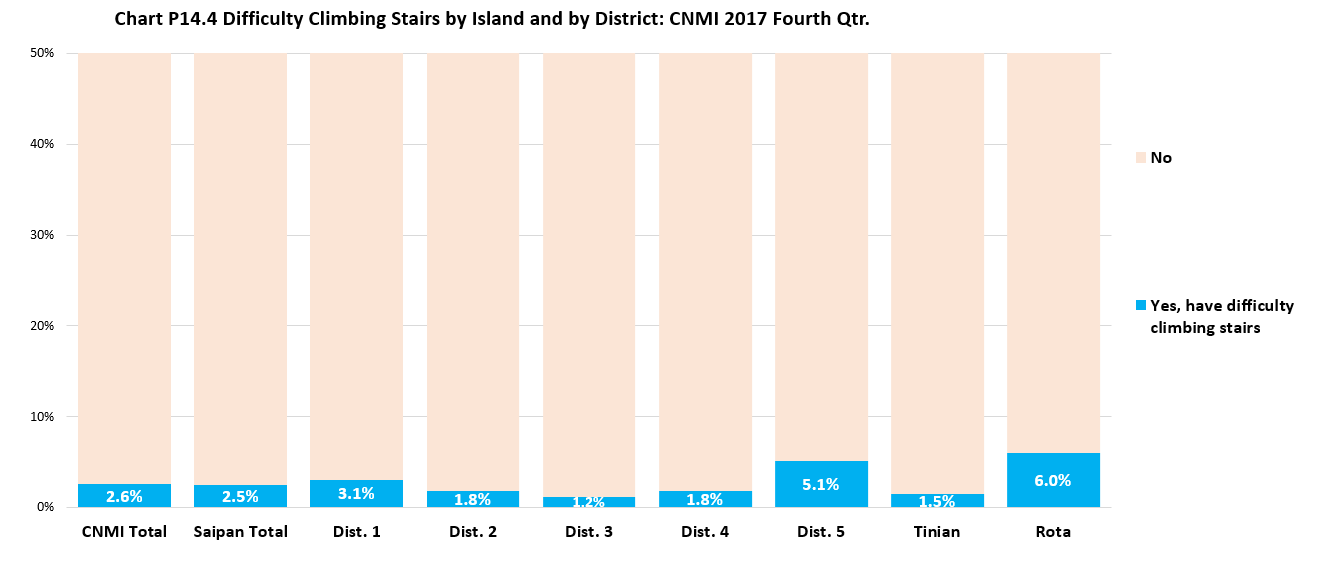
Persons with difficulty climbing stairs was 2.6% of the CNMI’s population in 2017.
By Island
The persons with difficulty climbing stairs percentage was higher in Rota (6.0%) than in Saipan (2.5%) and in Tinian (1.5%).
By Saipan Districts
The persons with difficulty climbing stairs percentage was highest in District 5 (5.1%) and lowest in District 3 (1.2%).
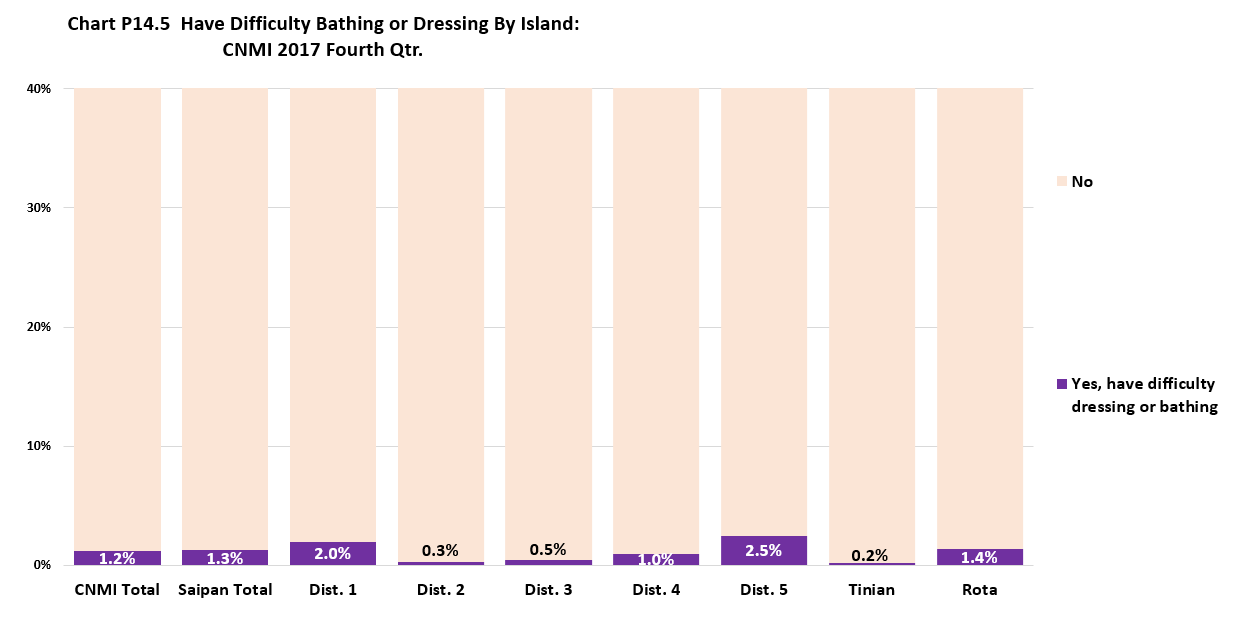
CNMI Total
Persons with difficulty bathing or dressing was 1.2% of the CNMI’s population in 2017.
By Island
The persons with difficulty bathing or dressing percentage was relatively higher in Rota (1.4%) than in Saipan (1.3%) and in Tinian (0.2%).
By Saipan Districts
The persons with difficulty bathing or dressing percentage was highest in District 5 (2.5%) and lowest in District 2 (0.3%).
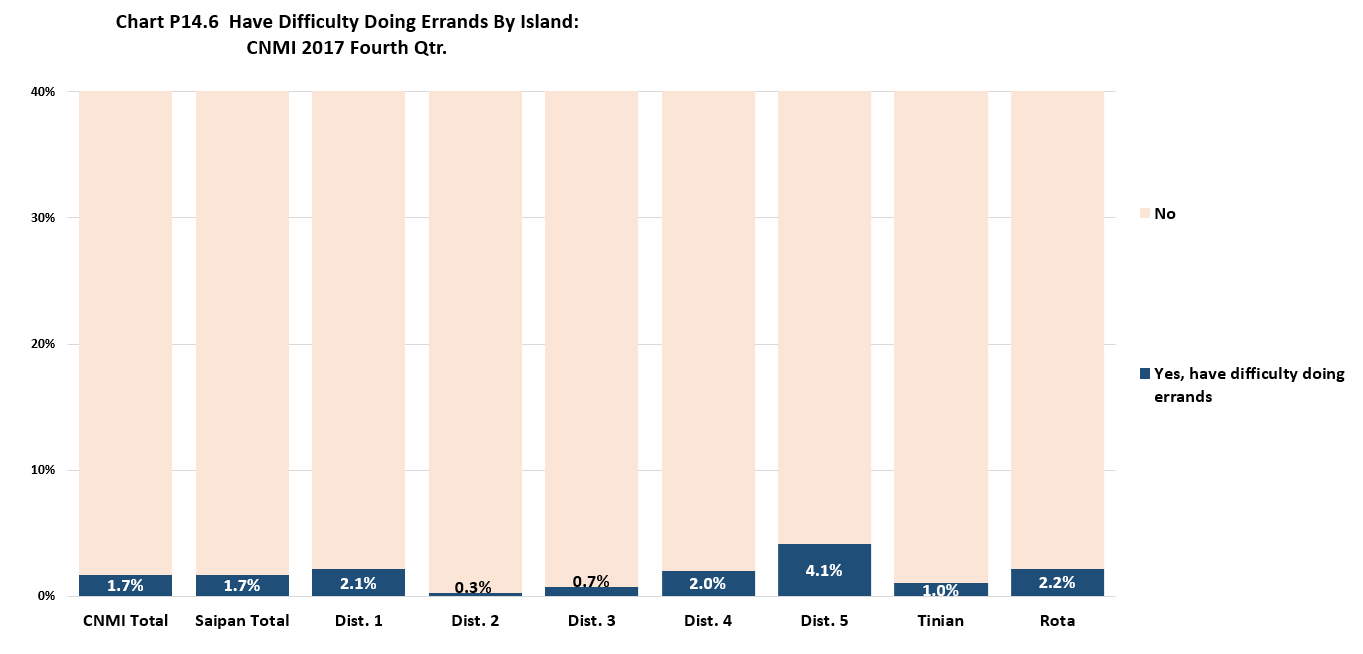
CNMI Total
Persons with difficulty doing errands was 1.7% of the CNMI’s population in 2017.
By Island
The persons with difficulty doing errands percentage was relatively higher in Rota (2.2%) than in Saipan (1.7%) and in Tinian (1.0%).
By Saipan Districts
The persons with difficulty doing errands percentage was highest in District 5 (4.1%) and lowest in District 2 (0.3%).
Population Characteristics
Difficulty Hearing (Deaf)
LFS 2017 Table P14.1 Deaf by Island and by District: CNMI 2017 Fourth Qtr.
| Deaf |
CNMI
Total |
Saipan
Total |
Saipan
Dist. 1 |
Saipan
Dist. 2 |
Saipan
Dist. 3 |
Saipan
Dist. 4 |
Saipan
Dist. 5 |
Tinian
Dist. 6 |
Rota
Dist. 7 |
|
|
|
|
|
|
|
|
|
Source: Labor Force Survey CNMI, 2017 4th Qrt. |
| Yes, difficulty hearing |
1,139 |
1,010 |
313 |
176 |
263 |
62 |
197 |
48 |
81 |
| No |
51,124 |
46,554 |
14,103 |
6,390 |
14,956 |
3,830 |
7,276 |
2,578 |
1,991 |
LFS 2017 Table P14.1 Deaf by Island and by District: CNMI 2017 Fourth Qtr. (Distribution Within)
| Deaf |
CNMI
Total |
Saipan
Total |
Saipan
Dist. 1 |
Saipan
Dist. 2 |
Saipan
Dist. 3 |
Saipan
Dist. 4 |
Saipan
Dist. 5 |
Tinian
Dist. 6 |
Rota
Dist. 7 |
|
|
|
|
|
|
|
|
|
Source: Labor Force Survey CNMI, 2017 4th Qrt. |
| Yes, difficulty hearing |
2.20% |
2.10% |
2.20% |
2.70% |
1.70% |
1.60% |
2.60% |
1.80% |
3.90% |
| No |
97.80% |
97.90% |
97.80% |
97.30% |
98.30% |
98.40% |
97.40% |
98.20% |
96.10% |
LFS 2017 Table P14.1 Deaf by Island and by District: CNMI 2017 Fourth Qtr. (Distribution Amoung)
| Deaf |
CNMI
Total |
Saipan
Total |
Saipan
Dist. 1 |
Saipan
Dist. 2 |
Saipan
Dist. 3 |
Saipan
Dist. 4 |
Saipan
Dist. 5 |
Tinian
Dist. 6 |
Rota
Dist. 7 |
|
|
|
|
|
|
|
|
|
Source: Labor Force Survey CNMI, 2017 4th Qrt. |
| Yes, difficulty hearing |
100% |
88.70% |
27.50% |
15.50% |
23.00% |
5.50% |
17.30% |
4.20% |
7.10% |
| No |
100% |
91.10% |
27.60% |
12.50% |
29.30% |
7.50% |
14.20% |
5.00% |
3.90% |
Difficulty Seeing (Blind)
LFS 2017 Table P14.2 Blind by Island and by District: CNMI 2017 Fourth Qtr.
| Blind |
CNMI
Total |
Saipan
Total |
Saipan
Dist. 1 |
Saipan
Dist. 2 |
Saipan
Dist. 3 |
Saipan
Dist. 4 |
Saipan
Dist. 5 |
Tinian
Dist. 6 |
Rota
Dist. 7 |
|
|
|
|
|
|
|
|
|
Source: Labor Force Survey CNMI, 2017 4th Qrt. |
| Yes, difficulty seeing |
1216.35277 |
982.4405137 |
347.9139632 |
96.00992009 |
238.68627 |
0 |
299.8303603 |
118.8595343 |
115.0527222 |
| No |
51046.4732 |
46582.21633 |
14067.89599 |
6470.18617 |
14979.35185 |
3892.320661 |
7172.46167 |
2507.110381 |
1957.146482 |
LFS 2017 Table P14.2 Blind by Island and by District: CNMI 2017 Fourth Qtr. (Distribution Within)
| Blind |
CNMI
Total |
Saipan
Total |
Saipan
Dist. 1 |
Saipan
Dist. 2 |
Saipan
Dist. 3 |
Saipan
Dist. 4 |
Saipan
Dist. 5 |
Tinian
Dist. 6 |
Rota
Dist. 7 |
|
|
|
|
|
|
|
|
|
Source: Labor Force Survey CNMI, 2017 4th Qrt. |
| Yes, difficulty seeing |
2.30% |
2.10% |
2.40% |
1.50% |
1.60% |
0.00% |
4.00% |
4.50% |
5.60% |
| No |
97.70% |
97.90% |
97.60% |
98.50% |
98.40% |
100.00% |
96.00% |
95.50% |
94.40% |
LFS 2017 Table P14.2 Blind by Island and by District: CNMI 2017 Fourth Qtr. (Distribution Amoung)
| Blind |
CNMI
Total |
Saipan
Total |
Saipan
Dist. 1 |
Saipan
Dist. 2 |
Saipan
Dist. 3 |
Saipan
Dist. 4 |
Saipan
Dist. 5 |
Tinian
Dist. 6 |
Rota
Dist. 7 |
|
|
|
|
|
|
|
|
|
Source: Labor Force Survey CNMI, 2017 4th Qrt. |
| Yes, difficulty seeing |
100% |
80.80% |
28.60% |
7.90% |
19.60% |
0.00% |
24.60% |
9.80% |
9.50% |
| No |
100% |
91.30% |
27.60% |
12.70% |
29.30% |
7.60% |
14.10% |
4.90% |
3.80% |
Physical, Mental, or Emotional Condition
LFS 2017 Table P14.3 Physical, Mental, or Emotional Condition by Island and by District: CNMI 2017 Fourth Qtr.
| Physical, Mental, or Emptional Condition |
CNMI
Total |
Saipan
Total |
Saipan
Dist. 1 |
Saipan
Dist. 2 |
Saipan
Dist. 3 |
Saipan
Dist. 4 |
Saipan
Dist. 5 |
Tinian
Dist. 6 |
Rota
Dist. 7 |
|
|
|
|
|
|
|
|
|
Source: Labor Force Survey CNMI, 2017 4th Qrt. |
| Yes, have physical, mental, or emotional condition |
793 |
681 |
211 |
58 |
130 |
39 |
243 |
29 |
83 |
| No |
51,470 |
46,884 |
14,205 |
6,509 |
15,088 |
3,853 |
7,229 |
2,597 |
1,989 |
LFS 2017 Table P14.3 Physical, Mental, or Emotional Condition by Island and by District: CNMI 2017 Fourth Qtr. (Distribution Within)
| Physical, Mental, or Emptional Condition |
CNMI
Total |
Saipan
Total |
Saipan
Dist. 1 |
Saipan
Dist. 2 |
Saipan
Dist. 3 |
Saipan
Dist. 4 |
Saipan
Dist. 5 |
Tinian
Dist. 6 |
Rota
Dist. 7 |
|
|
|
|
|
|
|
|
|
Source: Labor Force Survey CNMI, 2017 4th Qrt. |
| Yes, have physical, mental, or emotional condition |
1.50% |
1.40% |
1.50% |
0.90% |
0.90% |
1.00% |
3.30% |
1.10% |
4.00% |
| No |
98.50% |
98.60% |
98.50% |
99.10% |
99.10% |
99.00% |
96.70% |
98.90% |
96.00% |
LFS 2017 Table P14.3 Physical, Mental, or Emotional Condition by Island and by District: CNMI 2017 Fourth Qtr. (Distribution Amoung)
| Physical, Mental, or Emptional Condition |
CNMI
Total |
Saipan
Total |
Saipan
Dist. 1 |
Saipan
Dist. 2 |
Saipan
Dist. 3 |
Saipan
Dist. 4 |
Saipan
Dist. 5 |
Tinian
Dist. 6 |
Rota
Dist. 7 |
|
|
|
|
|
|
|
|
|
Source: Labor Force Survey CNMI, 2017 4th Qrt. |
| Yes, have physical, mental, or emotional condition |
100% |
85.80% |
26.60% |
7.30% |
16.40% |
4.90% |
30.70% |
3.70% |
10.50% |
| No |
100% |
91.10% |
27.60% |
12.60% |
29.30% |
7.50% |
14.00% |
5.00% |
3.90% |
Difficulty Walking or Climbing Stairs
LFS 2017 Table P14.4 Difficulty Climbing Stairs by Island and by District: CNMI 2017 Fourth Qtr.
| Difficulty Climbing Stairs |
CNMI
Total |
Saipan
Total |
Saipan
Dist. 1 |
Saipan
Dist. 2 |
Saipan
Dist. 3 |
Saipan
Dist. 4 |
Saipan
Dist. 5 |
Tinian
Dist. 6 |
Rota
Dist. 7 |
|
|
|
|
|
|
|
|
|
Source: Labor Force Survey CNMI, 2017 4th Qrt. |
| Yes, have difficulty climbing stairs |
1,356 |
1,195 |
443 |
119 |
184 |
70 |
380 |
39 |
123 |
| No |
50,906 |
46,370 |
13,973 |
6,448 |
15,034 |
3,823 |
7,093 |
2,587 |
1,949 |
LFS 2017 Table P14.4 Difficulty Climbing Stairs by Island and by District: CNMI 2017 Fourth Qtr. (Distribution Within)
| Difficulty Climbing Stairs |
CNMI
Total |
Saipan
Total |
Saipan
Dist. 1 |
Saipan
Dist. 2 |
Saipan
Dist. 3 |
Saipan
Dist. 4 |
Saipan
Dist. 5 |
Tinian
Dist. 6 |
Rota
Dist. 7 |
|
|
|
|
|
|
|
|
|
Source: Labor Force Survey CNMI, 2017 4th Qrt. |
| Yes, have difficulty climbing stairs |
2.60% |
2.50% |
3.10% |
1.80% |
1.20% |
1.80% |
5.10% |
1.50% |
6.00% |
| No |
97.40% |
97.50% |
96.90% |
98.20% |
98.80% |
98.20% |
94.90% |
98.50% |
94.00% |
LFS 2017 Table P14.4 Difficulty Climbing Stairs by Island and by District: CNMI 2017 Fourth Qtr. (Distribution Amoung)
| Difficulty Climbing Stairs |
CNMI
Total |
Saipan
Total |
Saipan
Dist. 1 |
Saipan
Dist. 2 |
Saipan
Dist. 3 |
Saipan
Dist. 4 |
Saipan
Dist. 5 |
Tinian
Dist. 6 |
Rota
Dist. 7 |
|
|
|
|
|
|
|
|
|
Source: Labor Force Survey CNMI, 2017 4th Qrt. |
| Yes, have difficulty climbing stairs |
100% |
88.10% |
32.60% |
8.70% |
13.50% |
5.10% |
28.00% |
2.80% |
9.10% |
| No |
100% |
91.10% |
27.40% |
12.70% |
29.50% |
7.50% |
13.90% |
5.10% |
3.80% |
Difficulty Bathing or Dressing
LFS 2017 Table P14.5 Difficulty Bathing or Dressing by Island and by District: CNMI 2017 Fourth Qtr.
| Difficulty Bathing or Dressing |
CNMI
Total |
Saipan
Total |
Saipan
Dist. 1 |
Saipan
Dist. 2 |
Saipan
Dist. 3 |
Saipan
Dist. 4 |
Saipan
Dist. 5 |
Tinian
Dist. 6 |
Rota
Dist. 7 |
|
|
|
|
|
|
|
|
|
Source: Labor Force Survey CNMI, 2017 4th Qrt. |
| Yes, have difficulty dressing or bathing |
638 |
603 |
287 |
19 |
71 |
39 |
187 |
6 |
29 |
| No |
51,625 |
46,961 |
14,129 |
6,547 |
15,147 |
3,854 |
7,285 |
2,620 |
2,043 |
LFS 2017 Table P14.5 Difficulty Bathing or Dressing by Island and by District: CNMI 2017 Fourth Qtr. (Distribution Within)
| Difficulty Bathing or Dressing |
CNMI
Total |
Saipan
Total |
Saipan
Dist. 1 |
Saipan
Dist. 2 |
Saipan
Dist. 3 |
Saipan
Dist. 4 |
Saipan
Dist. 5 |
Tinian
Dist. 6 |
Rota
Dist. 7 |
|
|
|
|
|
|
|
|
|
Source: Labor Force Survey CNMI, 2017 4th Qrt. |
| Yes, have difficulty dressing or bathing |
1.20% |
1.30% |
2.00% |
0.30% |
0.50% |
1.00% |
2.50% |
0.20% |
1.40% |
| No |
98.80% |
98.70% |
98.00% |
99.70% |
99.50% |
99.00% |
97.50% |
99.80% |
98.60% |
LFS 2017 Table P14.5 Difficulty Bathing or Dressing by Island and by District: CNMI 2017 Fourth Qtr. (Distribution Amoung)
| Difficulty Bathing or Dressing |
CNMI
Total |
Saipan
Total |
Saipan
Dist. 1 |
Saipan
Dist. 2 |
Saipan
Dist. 3 |
Saipan
Dist. 4 |
Saipan
Dist. 5 |
Tinian
Dist. 6 |
Rota
Dist. 7 |
|
|
|
|
|
|
|
|
|
Source: Labor Force Survey CNMI, 2017 4th Qrt. |
| Yes, have difficulty dressing or bathing |
100% |
94.60% |
45.00% |
3.00% |
11.10% |
6.10% |
29.40% |
0.90% |
4.60% |
| No |
100% |
91.00% |
27.40% |
12.70% |
29.30% |
7.50% |
14.10% |
5.10% |
4.00% |
Difficulty Doing Errands
LFS 2017 Table P14.6 Difficulty Doing Erands by Island and by District: CNMI 2017 Fourth Qtr.
| Difficulty Doing Errands |
CNMI
Total |
Saipan
Total |
Saipan
Dist. 1 |
Saipan
Dist. 2 |
Saipan
Dist. 3 |
Saipan
Dist. 4 |
Saipan
Dist. 5 |
Tinian
Dist. 6 |
Rota
Dist. 7 |
|
|
|
|
|
|
|
|
|
Source: Labor Force Survey CNMI, 2017 4th Qrt. |
| Yes, have difficulty doing errands |
893 |
821 |
307 |
19 |
110 |
78 |
307 |
27 |
45 |
| No |
51,370 |
46,744 |
14,109 |
6,547 |
15,108 |
3,815 |
7,166 |
2,599 |
2,027 |
LFS 2017 Table P14.6 Difficulty Doing Erands by Island and by District: CNMI 2017 Fourth Qtr. (Distribution Within)
| Difficulty Doing Errands |
CNMI
Total |
Saipan
Total |
Saipan
Dist. 1 |
Saipan
Dist. 2 |
Saipan
Dist. 3 |
Saipan
Dist. 4 |
Saipan
Dist. 5 |
Tinian
Dist. 6 |
Rota
Dist. 7 |
|
|
|
|
|
|
|
|
|
Source: Labor Force Survey CNMI, 2017 4th Qrt. |
| Yes, have difficulty doing errands |
1.70% |
1.70% |
2.10% |
0.30% |
0.70% |
2.00% |
4.10% |
1.00% |
2.20% |
| No |
98.30% |
98.30% |
97.90% |
99.70% |
99.30% |
98.00% |
95.90% |
99.00% |
97.80% |
LFS 2017 Table P14.6 Difficulty Doing Erands by Island and by District: CNMI 2017 Fourth Qtr. (Distribution Amoung)
| Difficulty Doing Errands |
CNMI
Total |
Saipan
Total |
Saipan
Dist. 1 |
Saipan
Dist. 2 |
Saipan
Dist. 3 |
Saipan
Dist. 4 |
Saipan
Dist. 5 |
Tinian
Dist. 6 |
Rota
Dist. 7 |
|
|
|
|
|
|
|
|
|
Source: Labor Force Survey CNMI, 2017 4th Qrt. |
| Yes, have difficulty doing errands |
100% |
91.90% |
34.40% |
2.20% |
12.30% |
8.70% |
34.40% |
3.00% |
5.10% |
| No |
100% |
91.00% |
27.50% |
12.70% |
29.40% |
7.40% |
13.90% |
5.10% |
3.90% |