Labor Force Participation Survey 2017 Population Characteristics
CNMI Total
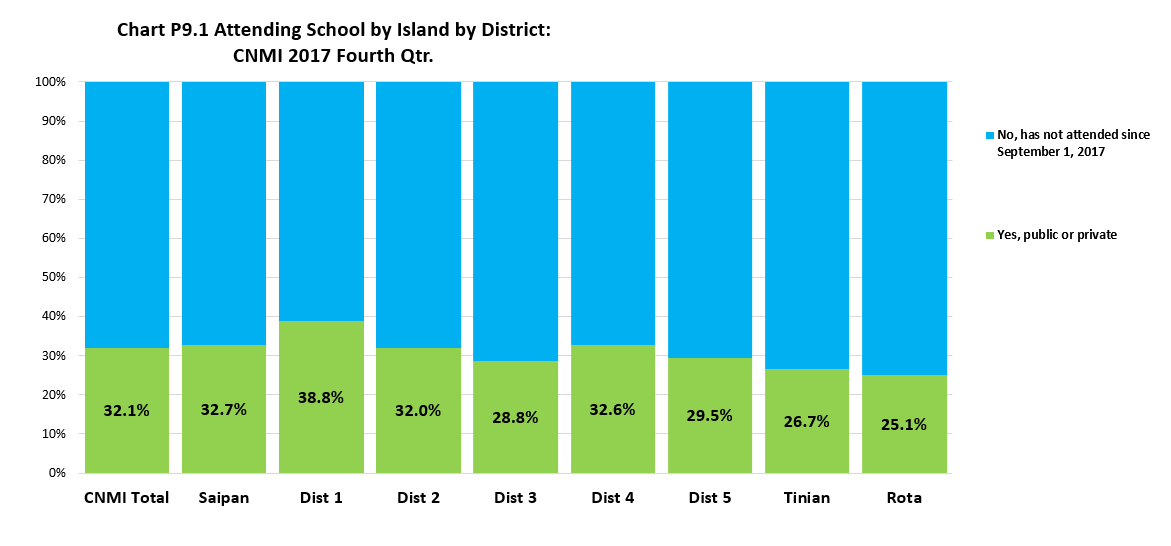
Persons attending school was 32.1% of the total population in the CNMI in 2017.
By Island
The persons attending school’s percentage was higher in Saipan (32.7%) than in Tinian (26.7%) and in Rota (25.1%).
By Saipan Districts
The persons attending school’s percentage was highest in District 1 (38.8%) and lowest in District 3 (28.8%).
CNMI Total
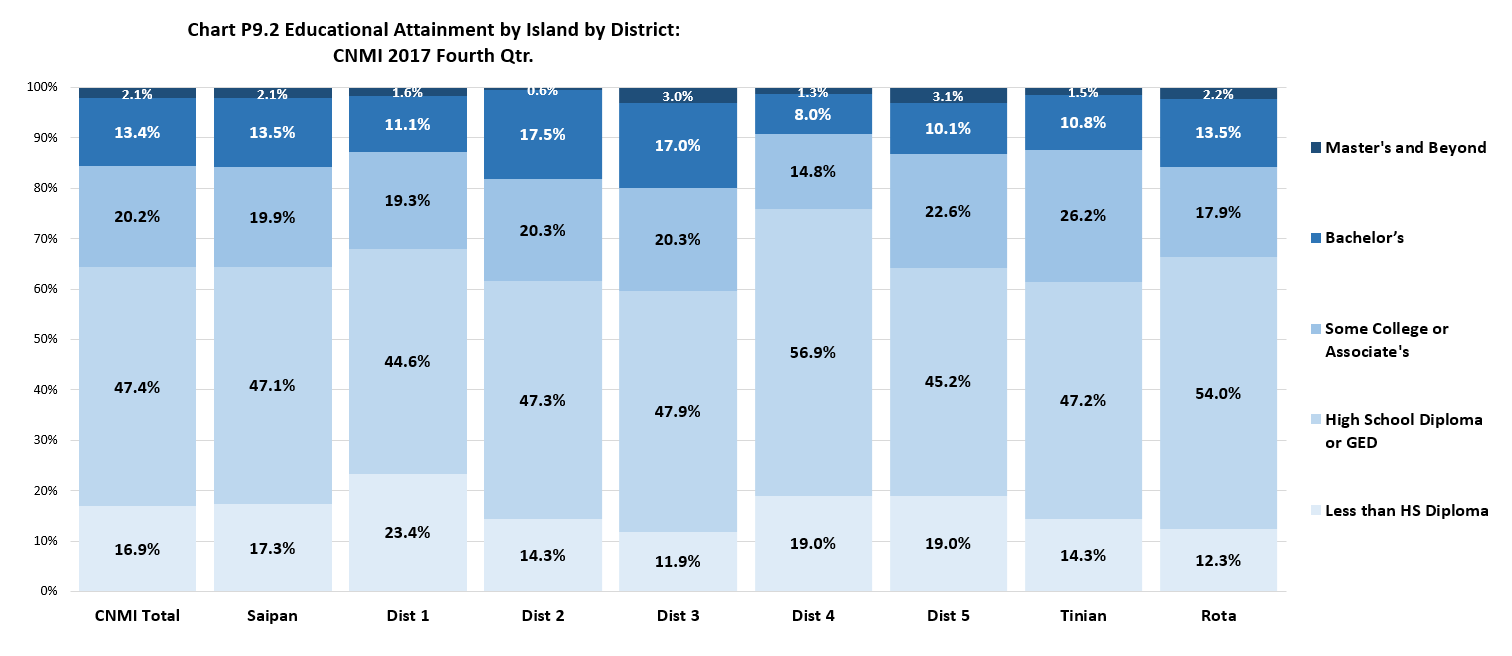
Persons with high school diploma or GED was 47.4% of the 25 years and older population in the CNMI in 2017. Persons with some college or Associate’s degree was 20.2%; those with less than high school diploma was 16.9%; those with a Bachelor’s degree was 13.4%; and those with a Master’s and beyond was 2.1%.
By Island
The percentage of persons with high school diploma or GED was higher in Rota (54.0%) than in Tinian (47.2%) and in Saipan (47.1%). The percentage with some college or Associate’s was higher in Tinian (26.2%) than in Saipan (19.9%) and in Rota (17.9%). The percentage with a Bachelor’s was the same in Tinian and Saipan (both 13.5%) and was lower on Tinian (10.8%). The percentage with a Masters was practically the same in in all three islands. The percentage with less than high school diploma as higher in Saipan (17.3%) than in Tinian (14.3%) and in Rota (12.3%).
By Saipan Districts
The percentage of persons with high school diploma or GED was highest in District 4 (56.9%) and lowest in District 1 (44.6%); the percentage with some college and Associates was highest in District 5 (22.6%) and lowest in District 4 (14.8%); the percentage with a Bachelor’s was highest in District 2 (17.5%) and lowest in District 4 (8.0%); the percentage with a Master’s was highest in District 3 (3.0%) and lowest in District 2 (0.6%); and the percentage of persons with less than high school diploma was highest in District 1 (23.4%) and lowest in District 3 (11.9%).
Population Characteristics
LFS 2017 Table P9.1 Attending School by Island and by District : CNMI 2017 Fourth Qtr.
| Attending School | CNMI Total |
Saipan Total |
Saipan Dist. 1 |
Saipan Dist. 2 |
Saipan Dist. 3 |
Saipan Dist. 4 |
Saipan Dist. 5 |
Tinian Dist. 6 |
Rota Dist. 7 |
|---|---|---|---|---|---|---|---|---|---|
| Source: Labor Force Survey CNMI, 2017 4th Qrt. | |||||||||
| Yes, public or private | 16,768 | 15,548 | 5,595 | 2,101 | 4,378 | 1,271 | 2,203 | 700 | 520 |
| No, has not attended since September 1, 2017 | 35,494 | 32,017 | 8,821 | 4,465 | 10,841 | 2,622 | 5,269 | 1,926 | 1,552 |
LFS 2017 Table P9.1 Attending School by Island and by District : CNMI 2017 Fourth Qtr. (Distribution Within)
| Attending School | CNMI Total |
Saipan Total |
Saipan Dist. 1 |
Saipan Dist. 2 |
Saipan Dist. 3 |
Saipan Dist. 4 |
Saipan Dist. 5 |
Tinian Dist. 6 |
Rota Dist. 7 |
|---|---|---|---|---|---|---|---|---|---|
| Source: Labor Force Survey CNMI, 2017 4th Qrt. | |||||||||
| Yes, public or private | 32.10% | 32.70% | 38.80% | 32.00% | 28.80% | 32.60% | 29.50% | 26.70% | 25.10% |
| No, has not attended since September 1, 2017 | 67.90% | 67.30% | 61.20% | 68.00% | 71.20% | 67.40% | 70.50% | 73.30% | 74.90% |
LFS 2017 Table P9.1 Attending School by Island and by District : CNMI 2017 Fourth Qtr. (Distribution Amoung)
| Attending School | CNMI Total |
Saipan Total |
Saipan Dist. 1 |
Saipan Dist. 2 |
Saipan Dist. 3 |
Saipan Dist. 4 |
Saipan Dist. 5 |
Tinian Dist. 6 |
Rota Dist. 7 |
|---|---|---|---|---|---|---|---|---|---|
| Source: Labor Force Survey CNMI, 2017 4th Qrt. | |||||||||
| Yes, public or private | 100% | 92.70% | 33.40% | 12.50% | 26.10% | 7.60% | 13.10% | 4.20% | 3.10% |
| No, has not attended since September 1, 2017 | 100% | 90.20% | 24.90% | 12.60% | 30.50% | 7.40% | 14.80% | 5.40% | 4.40% |
LFS 2017 Table P9.2 Educational Attainment by Island and by District: CNMI 2017 Fourth Qtr.
| Educational Attainment | CNMI Total |
Saipan Total |
Saipan Dist. 1 |
Saipan Dist. 2 |
Saipan Dist. 3 |
Saipan Dist. 4 |
Saipan Dist. 5 |
Tinian Dist. 6 |
Rota Dist. 7 |
|---|---|---|---|---|---|---|---|---|---|
| Universe: 25 yrs or over | Source: Labor Force Survey CNMI, 2017 4th Qrt. | ||||||||
| Less than HS Diploma | 5,259 | 4,855 | 1,956 | 529 | 1,111 | 420 | 839 | 240 | 164 |
| High School Diploma or GED | 14,715 | 13,207 | 3,733 | 1,742 | 4,482 | 1,256 | 1,994 | 790 | 718 |
| Some College or Associate’s | 6,262 | 5,586 | 1,616 | 749 | 1,899 | 327 | 995 | 438 | 238 |
| Bachelors degree | 4,154 | 3,793 | 933 | 646 | 1,595 | 176 | 443 | 181 | 180 |
| Master’s and Beyond | 655 | 601 | 136 | 21 | 278 | 29 | 137 | 25 | 29 |
LFS 2017 Table P9.2 Educational Attainment by Island and by District: CNMI 2017 Fourth Qtr. (Distribution Within)
| Educational Attainment | CNMI Total |
Saipan Total |
Saipan Dist. 1 |
Saipan Dist. 2 |
Saipan Dist. 3 |
Saipan Dist. 4 |
Saipan Dist. 5 |
Tinian Dist. 6 |
Rota Dist. 7 |
|---|---|---|---|---|---|---|---|---|---|
| Universe: 25 yrs or over | Source: Labor Force Survey CNMI, 2017 4th Qrt. | ||||||||
| Less than HS Diploma | 16.90% | 17.30% | 23.40% | 14.30% | 11.90% | 19.00% | 19.00% | 14.30% | 12.30% |
| High School Diploma or GED | 47.40% | 47.10% | 44.60% | 47.30% | 47.90% | 56.90% | 45.20% | 47.20% | 54.00% |
| Some College or Associate’s | 20.20% | 19.90% | 19.30% | 20.30% | 20.30% | 14.80% | 22.60% | 26.20% | 17.90% |
| Bachelors degree | 13.40% | 13.50% | 11.10% | 17.50% | 17.00% | 8.00% | 10.10% | 10.80% | 13.50% |
| Master’s and Beyond | 2.10% | 2.10% | 1.60% | 0.60% | 3.00% | 1.30% | 3.10% | 1.50% | 2.20% |
LFS 2017 Table P9.2 Educational Attainment by Island and by District: CNMI 2017 Fourth Qtr. (Distribution Amoung)
| Educational Attainment | CNMI Total |
Saipan Total |
Saipan Dist. 1 |
Saipan Dist. 2 |
Saipan Dist. 3 |
Saipan Dist. 4 |
Saipan Dist. 5 |
Tinian Dist. 6 |
Rota Dist. 7 |
|---|---|---|---|---|---|---|---|---|---|
| Universe: 25 yrs or over | Source: Labor Force Survey CNMI, 2017 4th Qrt. | ||||||||
| Less than HS Diploma | 100% | 92.30% | 37.20% | 10.10% | 21.10% | 8.00% | 16.00% | 4.60% | 3.10% |
| High School Diploma or GED | 100% | 89.80% | 25.40% | 11.80% | 30.50% | 8.50% | 13.60% | 5.40% | 4.90% |
| Some College or Associate’s | 100% | 89.20% | 25.80% | 12.00% | 30.30% | 5.20% | 15.90% | 7.00% | 3.80% |
| Bachelors degree | 100% | 91.30% | 22.40% | 15.50% | 38.40% | 4.20% | 10.70% | 4.40% | 4.30% |
| Master’s and Beyond | 100% | 91.70% | 20.80% | 3.20% | 42.40% | 4.40% | 20.90% | 3.80% | 4.40% |
Population Characteristics
To download, right click on the chart and select “Save Image As”…