CNMI LABOR FORCE PARTICIPATION SURVEY 2017 POPULATION CHARACTERISTICS
CNMI Total
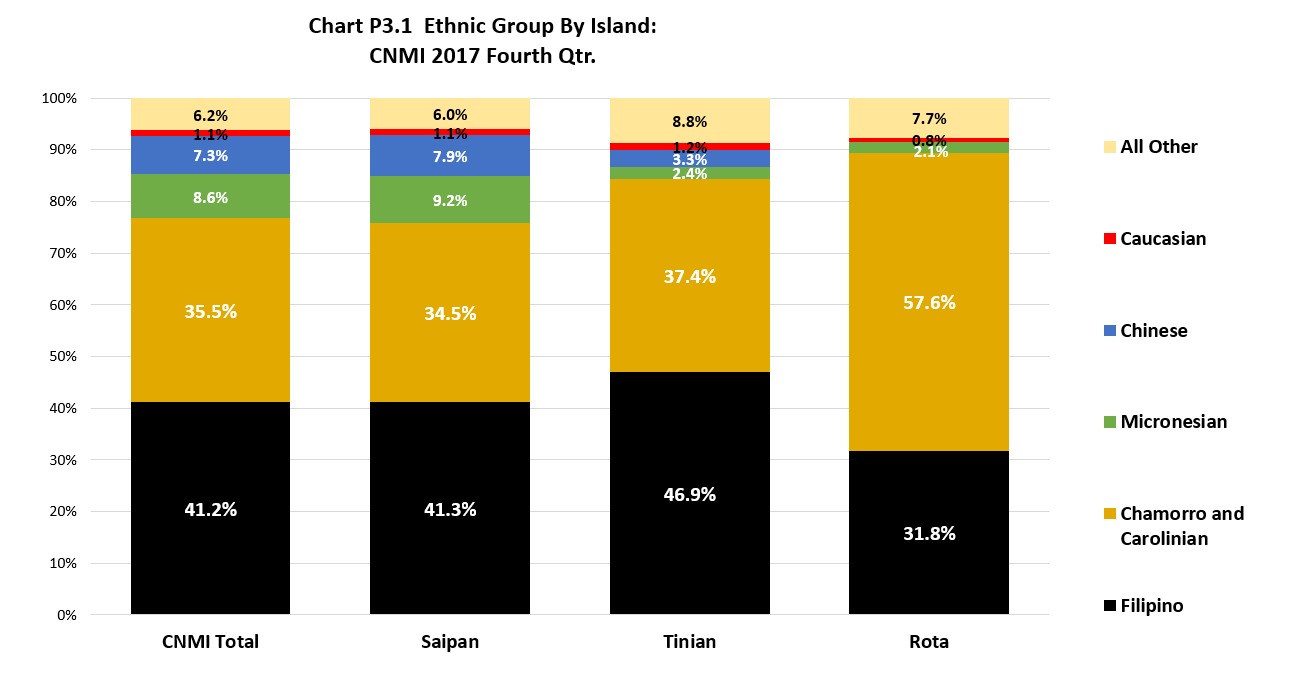
Filipino was the largest (41.2%) single ethnic group in the CNMI in 2017, followed by Chamorro and Carolinian (35.5%), Micronesian (8.6%), and Chinese (7.3%). Caucasian was the smallest (1.1%) while other ethnic groups made up 6.2% of the total population.
By Island
The Filipino’s percentage was higher in Tinian (46.9%) than in Saipan (41.3%) and in Rota (31.8%). The Chamorro and Carolinian’s percentage was higher in Rota (57.6%) than in Tinian (37.4%) and in Saipan (34.5%). The Micronesian’s percentage was higher in Saipan (9.2%) than in Tinian (2.4%) and in Rota (2.1%). The Chinese’ percentage was relatively higher in Saipan (7.9%) than in Tinian (3.3%). No Chinese was captured in the survey in Rota.
By Saipan Districts
At this level of aggregation, there were no reliable estimates of ethnic group by Districts within Saipan.
Population Characteristics
LFS 2017 Table P3.1 Ethnic Group by Island and by District: CNMI 2017 Fourth Qtr.
| Ethic Group | CNMI Total |
Saipan | Tinian | Rota |
|---|---|---|---|---|
| Source: Labor Force Survey CNMI, 2017 4th Qrt. | ||||
| Chamorro and Carolinian | 18,564 | 16,388 | 982 | 1,194 |
| Micronesian | 4,503 | 4,395 | 63 | 44 |
| Other Pac Islander | 200 | 200 | – | – |
| Caucasian | 574 | 524 | 32 | 17 |
| Chinese | 3,829 | 3,743 | 86 | – |
| Japanese | 435 | 410 | 10 | 16 |
| Korean | 757 | 733 | 11 | 12 |
| Filipino | 21,537 | 19,646 | 1,232 | 658 |
| Other Asian | 1,683 | 1,352 | 205 | 125 |
| Other Single | 182 | 172 | 4 | 6 |
LFS 2017 Table P3.1 Ethnic Group by Island and by District: CNMI 2017 Fourth Qtr. (Distribution Within)
| Ethic Group | CNMI Total |
Saipan | Tinian | Rota |
|---|---|---|---|---|
| Source: Labor Force Survey CNMI, 2017 4th Qrt. | ||||
| Chamorro and Carolinian | 35.5% | 34.5% | 37.4% | 57.6% |
| Micronesian | 8.6% | 9.2% | 2.4% | 2.1% |
| Other Pac Islander | 0.4% | 0.4% | 0% | 0% |
| Caucasian | 1.1% | 1.1% | 1.2% | 0.8% |
| Chinese | 7.3% | 7.9% | 3.3% | 0% |
| Japanese | 0.8% | 0.9% | 0.4% | 0.7% |
| Korean | 1.4% | 1.5% | 0.4% | 0.6% |
| Filipino | 41.2% | 41.3% | 46.9% | 31.8% |
| Other Asian | 3.2% | 2.8% | 7.8% | 6.0% |
| Other Single | 0.3% | 0.4% | 0.1% | 0.3% |
LFS 2017 Table P3.1 Ethnic Group by Island and by District: CNMI 2017 Fourth Qtr. (Distribution Amoung)
| Ethic Group | CNMI Total |
Saipan | Tinian | Rota |
|---|---|---|---|---|
| Source: Labor Force Survey CNMI, 2017 4th Qrt. | ||||
| Chamorro and Carolinian | 100% | 88.3% | 5.3% | 6.4% |
| Micronesian | 100% | 97.6% | 1.4% | 1.0% |
| Other Pac Islander | 100% | 100% | 0% | 0% |
| Caucasian | 100% | 91.4% | 5.6% | 3.0% |
| Chinese | 100% | 97.8% | 2.2% | 0% |
| Japanese | 100% | 94.2% | 2.2% | 3.6% |
| Korean | 100% | 96.9% | 1.5% | 1.6% |
| Filipino | 100% | 91.2% | 5.7% | 3.1% |
| Other Asian | 100% | 80.4% | 12.2% | 7.4% |
| Other Single | 100% | 94.6% | 2.1% | 3.3% |
Population Characteristics
To download, right click on the chart and select “Save Image As”…