Labor Force Participation Survey 2017 Population Characteristics
CNMI Total
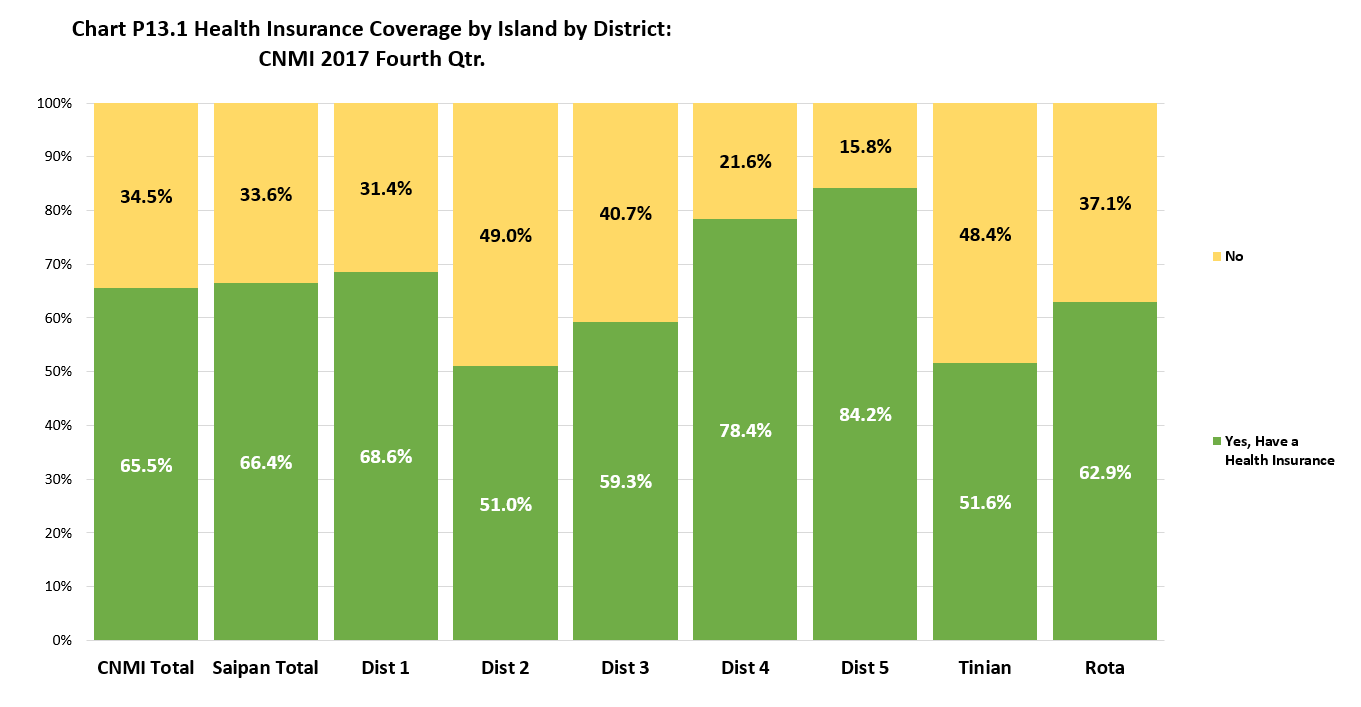
Persons with health insurance coverage was 65.6% of the CNMI’s population in 2017.
By Island
The percentage with health insurance coverage was higher in Saipan (66.4%) than in Rota (62.9%) and in Tinian (51.6%).
By Saipan Districts
The health insurance coverage percentage was highest in District 5 (84.2%) and lowest in District 2 (51.0%).
CNMI Total
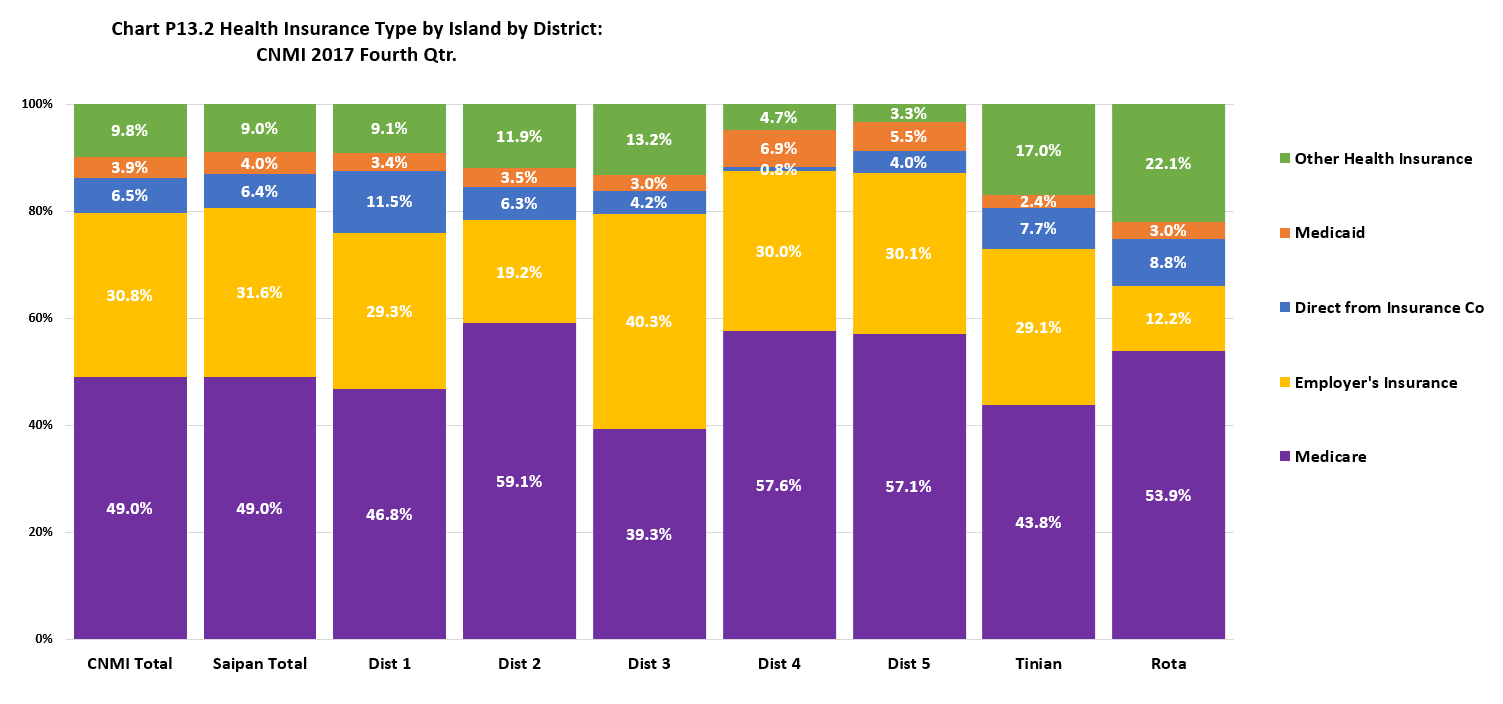
Medicare had the highest share (49.0%) of the total health insurance coverage in the CNIM in 2017, followed by employer’s insurance (30.8%), direct from insurance companies (6.5%), then Medicaid (3.9%). Other types of health insurance covered 9.8% of the covered population.
By Island
Medicare percentage share of total health insurance coverage was higher in Rota (53.9%) than in Saipan (49.0%) and in Tinian (43.8%). Employer’s insurance percentage share was higher in Saipan (31.6%) than in Tinian (29.1%) and lower in Rota (12.2%). Direct from insurance companies’ percentage share was not too different by island: Rota (8.8%), Tinian (7.7%), and Saipan (6.4%). Other health insurance percentage share was higher in Rota (22.1%) and Tinian (17.9%) and lower in Saipan (9.0%).
By Saipan Districts
Medicare percentage share was highest in District 2 (59.1%) and lowest in District 3 (39.3%). Employer’s insurance percentage share highest in District 3 (40.3%) and lowest in District 2 (19.2%). Direct from insurance companies’ percentage share was highest in District 1 (11.5%) and lowest in District 4 (0.8%). Other health insurance percentage share was highest in District 3 (13.2%) and lowest in District 5 (3.3%).
Population Characteristics
LFS 2017 Table P13.1 Health Insurance Coverage by Island and by District: CNMI 2017 Fourth Qtr.
| Health Insurance | CNMI Total |
Saipan Total |
Saipan Dist. 1 |
Saipan Dist. 2 |
Saipan Dist. 3 |
Saipan Dist. 4 |
Saipan Dist. 5 |
Tinian Dist. 6 |
Rota Dist. 7 |
|---|---|---|---|---|---|---|---|---|---|
| Source: Labor Force Survey CNMI, 2017 4th Qrt. | |||||||||
| Yes, Have a Health Insurance | 34,256 | 31,598 | 9,883 | 3,348 | 9,021 | 3,051 | 6,295 | 1,354 | 1,304 |
| No | 18,007 | 15,966 | 4,533 | 3,218 | 6,197 | 841 | 1,177 | 1,272 | 768 |
LFS 2017 Table P13.1 Health Insurance Coverage by Island and by District: CNMI 2017 Fourth Qtr. (Distribution Within)
| Health Insurance | CNMI Total |
Saipan Total |
Saipan Dist. 1 |
Saipan Dist. 2 |
Saipan Dist. 3 |
Saipan Dist. 4 |
Saipan Dist. 5 |
Tinian Dist. 6 |
Rota Dist. 7 |
|---|---|---|---|---|---|---|---|---|---|
| Source: Labor Force Survey CNMI, 2017 4th Qrt. | |||||||||
| Yes, Have a Health Insurance | 65.50% | 66.40% | 68.60% | 51.00% | 59.30% | 78.40% | 84.20% | 51.60% | 62.90% |
| No | 34.50% | 33.60% | 31.40% | 49.00% | 40.70% | 21.60% | 15.80% | 48.40% | 37.10% |
LFS 2017 Table P13.1 Health Insurance Coverage by Island and by District: CNMI 2017 Fourth Qtr. (Distribution Amoung)
| Health Insurance | CNMI Total |
Saipan Total |
Saipan Dist. 1 |
Saipan Dist. 2 |
Saipan Dist. 3 |
Saipan Dist. 4 |
Saipan Dist. 5 |
Tinian Dist. 6 |
Rota Dist. 7 |
|---|---|---|---|---|---|---|---|---|---|
| Source: Labor Force Survey CNMI, 2017 4th Qrt. | |||||||||
| Yes, Have a Health Insurance | 100% | 92.20% | 28.90% | 9.80% | 26.30% | 8.90% | 18.40% | 4.00% | 3.80% |
| No | 100% | 88.70% | 25.20% | 17.90% | 34.40% | 4.70% | 6.50% | 7.10% | 4.30% |
LFS 2017 Table P13.2 Health Insurance Type by Island and by District: CNMI 2017 Fourth Qtr.
| Health Insurance Type | CNMI Total |
Saipan Total |
Saipan Dist. 1 |
Saipan Dist. 2 |
Saipan Dist. 3 |
Saipan Dist. 4 |
Saipan Dist. 5 |
Tinian Dist. 6 |
Rota Dist. 7 |
|---|---|---|---|---|---|---|---|---|---|
| Source: Labor Force Survey CNMI, 2017 4th Qrt. | |||||||||
| Employer’s Insurance | 10,538 | 9,984 | 2,893 | 644 | 3,639 | 914 | 1,894 | 394 | 160 |
| Direct from Insurance Co | 2,229 | 2,011 | 1,139 | 211 | 382 | 25 | 253 | 104 | 114 |
| Medicaid | 1,347 | 1,275 | 332 | 117 | 270 | 211 | 346 | 32 | 39 |
| Medicare | 16,794 | 15,497 | 4,624 | 1,978 | 3,541 | 1,758 | 3,597 | 594 | 703 |
| Other Health Insurance | 3,349 | 2,832 | 895 | 398 | 1,188 | 144 | 207 | 230 | 288 |
LFS 2017 Table P13.2 Health Insurance Type by Island and by District: CNMI 2017 Fourth Qtr. (Distribution Within)
| Health Insurance Type | CNMI Total |
Saipan Total |
Saipan Dist. 1 |
Saipan Dist. 2 |
Saipan Dist. 3 |
Saipan Dist. 4 |
Saipan Dist. 5 |
Tinian Dist. 6 |
Rota Dist. 7 |
|---|---|---|---|---|---|---|---|---|---|
| Source: Labor Force Survey CNMI, 2017 4th Qrt. | |||||||||
| Employer’s Insurance | 30.80% | 31.60% | 29.30% | 19.20% | 40.30% | 30.00% | 30.10% | 29.10% | 12.20% |
| Direct from Insurance Co | 6.50% | 6.40% | 11.50% | 6.30% | 4.20% | 0.80% | 4.00% | 7.70% | 8.80% |
| Medicaid | 3.90% | 4.00% | 3.40% | 3.50% | 3.00% | 6.90% | 5.50% | 2.40% | 3.00% |
| Medicare | 49.00% | 49.00% | 46.80% | 59.10% | 39.30% | 57.60% | 57.10% | 43.80% | 53.90% |
| Other Health Insurance | 9.80% | 9.00% | 9.10% | 11.90% | 13.20% | 4.70% | 3.30% | 17.00% | 22.10% |
LFS 2017 Table P13.2 Health Insurance Type by Island and by District: CNMI 2017 Fourth Qtr. (Distribution Amoung)
| Health Insurance Type | CNMI Total |
Saipan Total |
Saipan Dist. 1 |
Saipan Dist. 2 |
Saipan Dist. 3 |
Saipan Dist. 4 |
Saipan Dist. 5 |
Tinian Dist. 6 |
Rota Dist. 7 |
|---|---|---|---|---|---|---|---|---|---|
| Source: Labor Force Survey CNMI, 2017 4th Qrt. | |||||||||
| Employer’s Insurance | 100% | 94.70% | 27.50% | 6.10% | 34.50% | 8.70% | 18.00% | 3.70% | 1.50% |
| Direct from Insurance Co | 100% | 90.20% | 51.10% | 9.50% | 17.10% | 1.10% | 11.30% | 4.70% | 5.10% |
| Medicaid | 100% | 94.70% | 24.60% | 8.70% | 20.10% | 15.60% | 25.70% | 2.40% | 2.90% |
| Medicare | 100% | 92.30% | 27.50% | 11.80% | 21.10% | 10.50% | 21.40% | 3.50% | 4.20% |
| Other Health Insurance | 100% | 84.50% | 26.70% | 11.90% | 35.50% | 4.30% | 6.20% | 6.90% | 8.60% |
Population Characteristics
To download, right click on the chart and select “Save Image As”…