Labor Force Participation Survey 2017 Population Characteristics
DescriptionTable DataCharts and Figures Data
CNMI Total
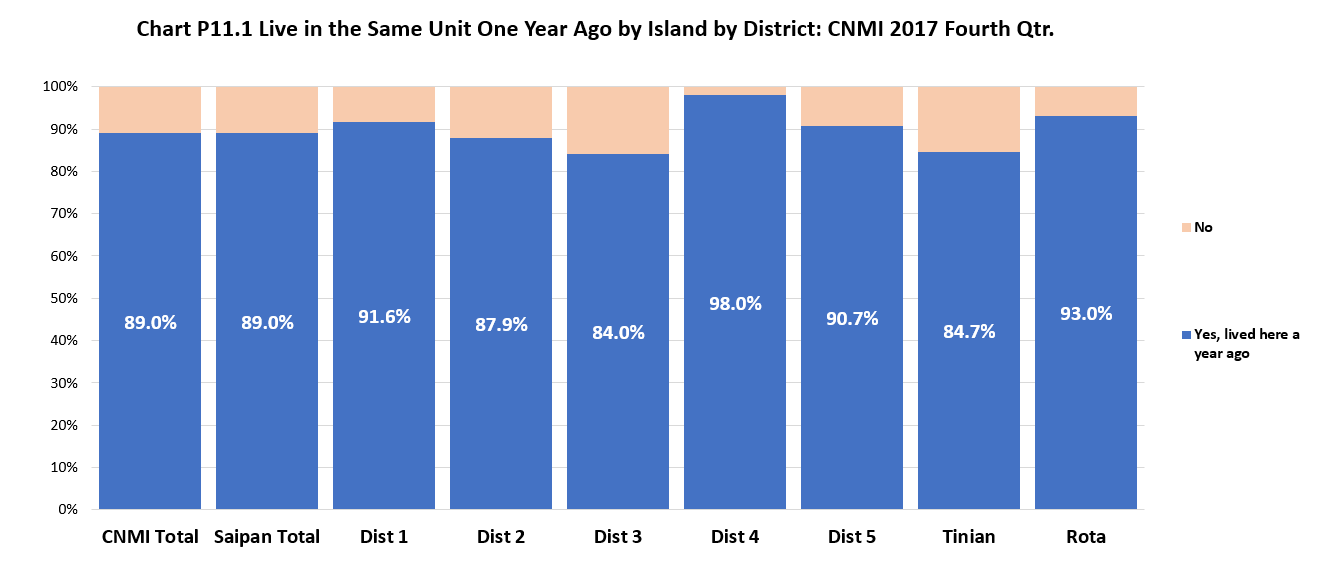
The person who lived in the same housing unit one year ago (2016) was 89.0% of the CNMI’s population in 2017.
By Island
The percentage of the population who lived in the same unit a year ago was higher in Rota (93.0%) than in Saipan (89.0%) and in Tinian (84.7%).
By Saipan Districts
The percentage of the population who lived in the same unit a year ago was highest in District 4 (98.0%) and lowest in District 3 (84.0%).
Population Characteristics
LFS 2017 Table P11.1 Lived in the Same House One Year Ago by Island and by District: CNMI 2017 Fourth Qtr.
| Lived in the same unit a year ago | CNMI Total |
Saipan Total |
Saipan Dist. 1 |
Saipan Dist. 2 |
Saipan Dist. 3 |
Saipan Dist. 4 |
Saipan Dist. 5 |
Tinian Dist. 6 |
Rota Dist. 7 |
|---|---|---|---|---|---|---|---|---|---|
| Source: Labor Force Survey CNMI, 2017 4th Qrt. | |||||||||
| Yes, lived here a year ago | 46,504 | 42,352 | 13,204 | 5,770 | 12,783 | 3,815 | 6,780 | 2,224 | 1,928 |
| No | 5,759 | 5,213 | 1,212 | 796 | 2,435 | 78 | 693 | 402 | 144 |
LFS 2017 Table P11.1 Lived in the Same House One Year Ago by Island and by District: CNMI 2017 Fourth Qtr. (Distribution Within)
| Lived in the same unit a year ago | CNMI Total |
Saipan Total |
Saipan Dist. 1 |
Saipan Dist. 2 |
Saipan Dist. 3 |
Saipan Dist. 4 |
Saipan Dist. 5 |
Tinian Dist. 6 |
Rota Dist. 7 |
|---|---|---|---|---|---|---|---|---|---|
| Source: Labor Force Survey CNMI, 2017 4th Qrt. | |||||||||
| Yes, lived here a year ago | 89.00% | 89.00% | 91.60% | 87.90% | 84.00% | 98.00% | 90.70% | 84.70% | 93.00% |
| No | 11.00% | 11.00% | 8.40% | 12.10% | 16.00% | 2.00% | 9.30% | 15.30% | 7.00% |
LFS 2017 Table P11.1 Lived in the Same House One Year Ago by Island and by District: CNMI 2017 Fourth Qtr. (Distribution Amoung)
| Lived in the same unit a year ago | CNMI Total |
Saipan Total |
Saipan Dist. 1 |
Saipan Dist. 2 |
Saipan Dist. 3 |
Saipan Dist. 4 |
Saipan Dist. 5 |
Tinian Dist. 6 |
Rota Dist. 7 |
|---|---|---|---|---|---|---|---|---|---|
| Source: Labor Force Survey CNMI, 2017 4th Qrt. | |||||||||
| Yes, lived here a year ago | 100% | 91.10% | 28.40% | 12.40% | 27.50% | 8.20% | 14.60% | 4.80% | 4.10% |
| No | 100% | 90.50% | 21.00% | 13.80% | 42.30% | 1.40% | 12.00% | 7.00% | 2.50% |
Population Characteristics
To download, right click on the chart and select “Save Image As”…