Labor Force Participation Survey 2017 Population Characteristics
CNMI Total
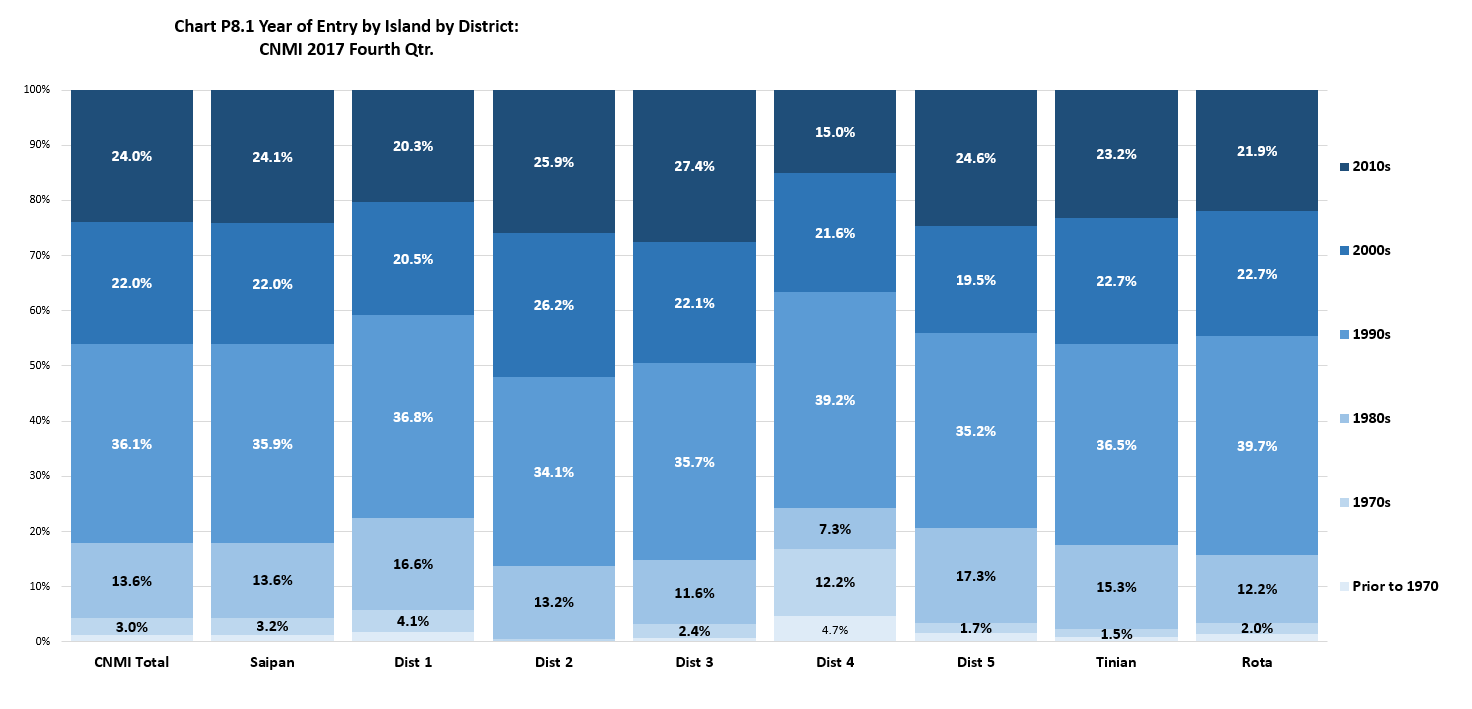
The migrants who entered the CNMI in the 1990s was 36.1% of the total migrant population in the CNMI in 2017. Those who entered in the 2010s was 24.0%, followed by those who entered in the 2000s (22.0%), those who entered in the 1980s (13.6%), while 4.2% entered in the 1970s and prior.
By Island
Migrants year of entry followed a similar pattern in Saipan and Tinian wherein the largest percentage of migrants came in the 1990s, followed by those who came in the 2010s, the 2000s, the 1980s, then the 1970s and prior. In Rota, while the largest percentage came in the 1990s (39.7%), it was followed by those who came in the 2000s (22.7%), the 2010s (21.9%), the 1980s (12.2%), then the 1970s (2.0%) and prior (1.5%).
By Saipan Districts
The percent distribution was not too different across all districts, except in District 4, wherein those that came in the 2010s was the lowest percentage (15.0%) and those that came in the 1990s was the highest (39.2%) among all districts. It is also important to note that 36.6% of all migrants lived in District 3 and 25.4% lived in District 1, at the time of the survey.
Population Characteristics
LFS 2017 Table P8.1 Year of Entry by Island and by District: CNMI 2017 Fourth Qtr.
| Year of Entry | CNMI Total |
Saipan Total |
Saipan Dist. 1 |
Saipan Dist. 2 |
Saipan Dist. 3 |
Saipan Dist. 4 |
Saipan Dist. 5 |
Tinian Dist. 6 |
Rota Dist. 7 |
|---|---|---|---|---|---|---|---|---|---|
| Source: Labor Force Survey CNMI, 2017 4th Qrt. | |||||||||
| 2010s | 5,433 | 4,980 | 1,164 | 805 | 2,274 | 197 | 540 | 274 | 179 |
| 2000s | 4,989 | 4,537 | 1,178 | 815 | 1,831 | 283 | 429 | 268 | 185 |
| 1990s | 8,171 | 7,417 | 2,110 | 1,061 | 2,957 | 514 | 775 | 431 | 324 |
| 1980s | 3,084 | 2,805 | 956 | 410 | 963 | 96 | 381 | 180 | 99 |
| 1970s | 685 | 652 | 235 | 19 | 200 | 160 | 37 | 17 | 16 |
| Prior to 1970 | 282 | 260 | 98 | – | 62 | 62 | 37 | 10 | 12 |
LFS 2017 Table P8.1 Year of Entry by Island and by District: CNMI 2017 Fourth Qtr. (Distribution Within)
| Year of Entry | CNMI Total |
Saipan Total |
Saipan Dist. 1 |
Saipan Dist. 2 |
Saipan Dist. 3 |
Saipan Dist. 4 |
Saipan Dist. 5 |
Tinian Dist. 6 |
Rota Dist. 7 |
|---|---|---|---|---|---|---|---|---|---|
| Source: Labor Force Survey CNMI, 2017 4th Qrt. | |||||||||
| 2010s | 24.00% | 24.10% | 20.30% | 25.90% | 27.40% | 15.00% | 24.60% | 23.20% | 21.90% |
| 2000s | 22.00% | 22.00% | 20.50% | 26.20% | 22.10% | 21.60% | 19.50% | 22.70% | 22.70% |
| 1990s | 36.10% | 35.90% | 36.80% | 34.10% | 35.70% | 39.20% | 35.20% | 36.50% | 39.70% |
| 1980s | 13.60% | 13.60% | 16.60% | 13.20% | 11.60% | 7.30% | 17.30% | 15.30% | 12.20% |
| 1970s | 3.00% | 3.20% | 4.10% | 0.60% | 2.40% | 12.20% | 1.70% | 1.50% | 2.00% |
| Prior to 1970 | 1.20% | 1.30% | 1.70% | 0.00% | 0.70% | 4.70% | 1.70% | 0.80% | 1.50% |
LFS 2017 Table P8.1 Year of Entry by Island and by District: CNMI 2017 Fourth Qtr. (Distribution Amoung)
| Year of Entry | CNMI Total |
Saipan Total |
Saipan Dist. 1 |
Saipan Dist. 2 |
Saipan Dist. 3 |
Saipan Dist. 4 |
Saipan Dist. 5 |
Tinian Dist. 6 |
Rota Dist. 7 |
|---|---|---|---|---|---|---|---|---|---|
| Source: Labor Force Survey CNMI, 2017 4th Qrt. | |||||||||
| 2010s | 100% | 91.70% | 21.40% | 14.80% | 41.90% | 3.60% | 9.90% | 5.00% | 3.30% |
| 2000s | 100% | 90.90% | 23.60% | 16.30% | 36.70% | 5.70% | 8.60% | 5.40% | 3.70% |
| 1990s | 100% | 90.80% | 25.80% | 13.00% | 36.20% | 6.30% | 9.50% | 5.30% | 4.00% |
| 1980s | 100% | 90.90% | 31.00% | 13.30% | 31.20% | 3.10% | 12.30% | 5.80% | 3.20% |
| 1970s | 100% | 95.10% | 34.30% | 2.80% | 29.20% | 23.30% | 5.50% | 2.50% | 2.40% |
| Prior to 1970 | 100% | 92.30% | 35.00% | 0.00% | 22.00% | 22.10% | 13.30% | 3.40% | 4.30% |
Population Characteristics
To download, right click on the chart and select “Save Image As”…


