CNMI LABOR FORCE PARTICIPATION SURVEY 2017 POPULATION CHARACTERISTICS
CNMI Total
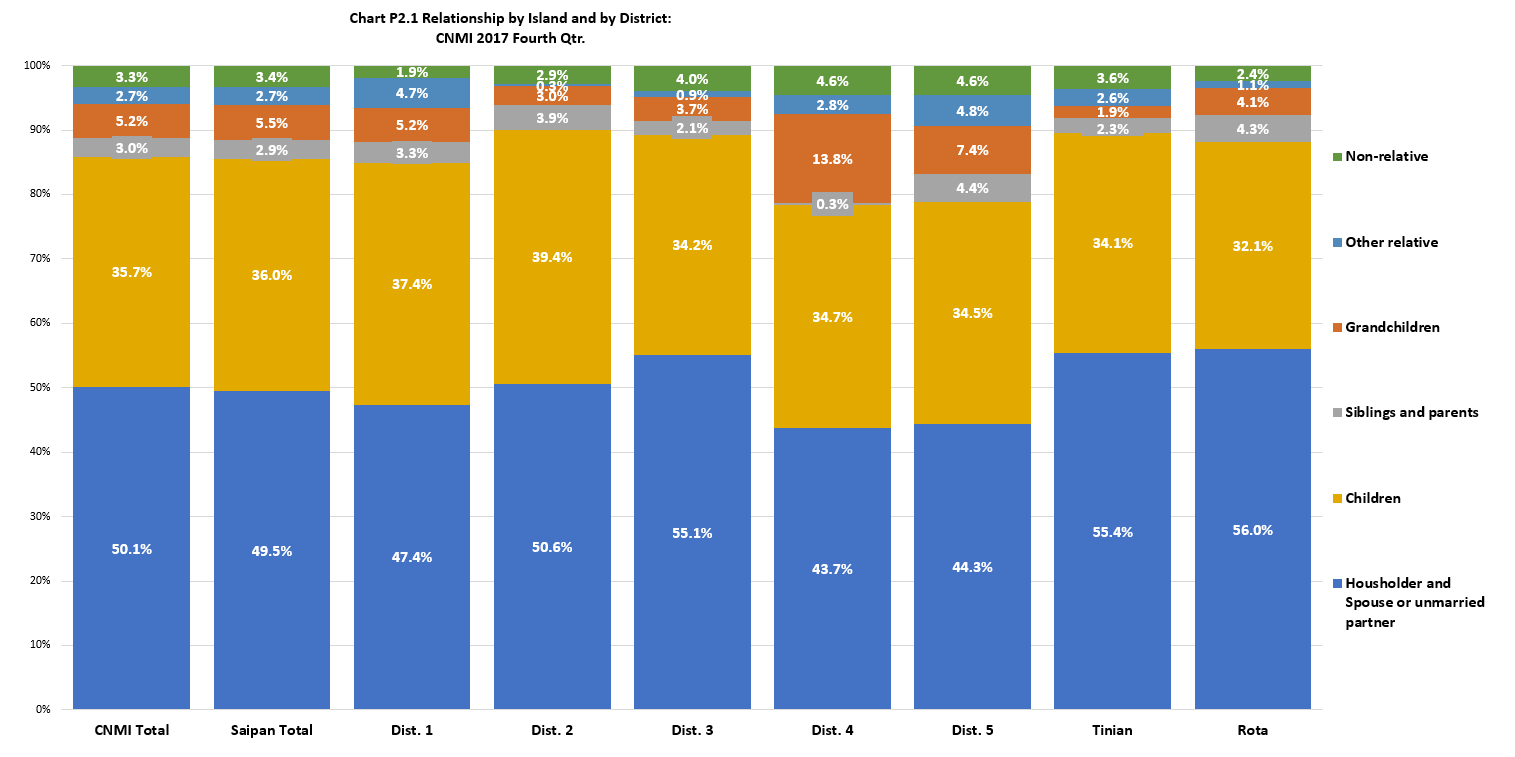
Householder and spouse or unmarried partner comprised half (50.1%) of the total population in the CNMI in 2017; children was 35.7%, siblings and parents was 3.0%, grandchildren was 5.2%, other relative was 2.7%, while nonrelative was 3.3% of the total population.
By Island
The householder and spouse or unmarried partner’s percentage was higher in Rota (56.0%), than in Tinian (55.4%) and Saipan (49.5%). The children percentage was higher in Saipan (36.0%) than in Tinian (34.1%) and in Rota (32.1%). The siblings and parents’ percentage was higher in Rota (4.3%) than in Saipan (2.9%) and in Tinian (2.3%). The grandchildren’s percentage was higher in Saipan (5.5%) than in Rota (4.1%) and Tinian (1.9%). The nonrelative’s percentage was higher in Tinian (3.6%) and Saipan (3.4%) and lower in Rota (2.4%).
By Saipan Districts
Within Saipan, householder and spouse or unmarried partner’s percentage was highest in District 3 (55.1%) and lowest in District 4 (44.3%). The children’s percentage was highest in District 2 (39.4%) and lowest in District 3 (34.2%). The siblings and parents’ percentage was highest in District 5 (4.4%) and lowest in District 4 (0.3%). The grandchildren’s percentage was highest in District 4 (13.8%) and lowest in District 2 (3.0%). The other relative’s percentage was highest in District 5 (4.8%) and lowest in District 2 (0.3%). The nonrelative’s percentage was higher in Districts 4 and 5 (both 4.6%) and lowest in District 1 (1.9%).
Population Characteristics
LFS 2017 Table P2.1 Relationship by Island and by District: CNMI 2017 Fourth Qtr.
| Relationship | CNMI Total |
Saipan Total |
Saipan Dist. 1 |
Saipan Dist. 2 |
Saipan Dist. 3 |
Saipan Dist. 4 |
Saipan Dist. 5 |
Tinian Dist. 6 |
Rota Dist. 7 |
|---|---|---|---|---|---|---|---|---|---|
| Source: Labor Force Survey CNMI, 2017 4th Qrt. | |||||||||
| Householder | 16,660 | 14,985 | 4,295 | 2,032 | 5,522 | 1,090 | 2,047 | 905 | 770 |
| Spouse | 8,519 | 7,720 | 2,302 | 1,171 | 2,589 | 580 | 1,078 | 477 | 322 |
| Natural or adopted son/daughter | 18,396 | 16,841 | 5,356 | 2,587 | 5,085 | 1,349 | 2,465 | 890 | 665 |
| Stepson/stepdaughter | 275 | 270 | 40 | – | 117 | – | 113 | 6 | – |
| Brother/sister | 793 | 740 | 250 | 119 | 164 | 13 | 194 | 31 | 23 |
| Father/mother | 756 | 660 | 231 | 134 | 158 | – | 136 | 31 | 66 |
| Grandchild | 2,732 | 2,597 | 754 | 194 | 559 | 539 | 551 | 51 | 85 |
| Other relative | 1,394 | 1,303 | 678 | 21 | 138 | 111 | 355 | 69 | 22 |
| Roomer, boarder, or foster child | 598 | 552 | 58 | 115 | 310 | 13 | 56 | 23 | 23 |
| Domestic worker/helper | 41 | 35 | – | – | 20 | 16 | – | – | 6 |
| Unmarried partner | 988 | 847 | 235 | 117 | 276 | 31 | 188 | 72 | 69 |
| Other nonrelative | 1,108 | 1,014 | 217 | 77 | 280 | 151 | 289 | 72 | 21 |
LFS 2017 Table P2.1 Relationship by Island and by District: CNMI 2017 Fourth Qtr. (Distribution Within)
| Relationship | CNMI Total |
Saipan Total |
Saipan Dist. 1 |
Saipan Dist. 2 |
Saipan Dist. 3 |
Saipan Dist. 4 |
Saipan Dist. 5 |
Tinian Dist. 6 |
Rota Dist. 7 |
|---|---|---|---|---|---|---|---|---|---|
| Source: Labor Force Survey CNMI, 2017 4th Qrt. | |||||||||
| Householder | 31.9% | 31.5% | 29.8% | 30.9% | 36.3% | 28.0% | 27.4% | 34.4% | 37.2% |
| Spouse | 16.3% | 16.2% | 16.0% | 17.8% | 17.0% | 14.9% | 14.4% | 18.2% | 15.5% |
| Natural or adopted son/daughter | 35.2% | 35.4% | 37.2% | 39.4% | 33.4% | 34.7% | 33.0% | 33.9% | 32.1% |
| Stepson/stepdaughter | 0.5% | 0.6% | 0.3% | 0% | 0.8% | 0% | 1.5% | 0.2% | 0% |
| Brother/sister | 1.5% | 1.6% | 1.7% | 1.8% | 1.1% | 0.3% | 2.6% | 1.2% | 1.1% |
| Father/mother | 1.4% | 1.4% | 1.6% | 2.0% | 1.0% | 0.0% | 1.8% | 1.2% | 3.2% |
| Grandchild | 5.2% | 5.5% | 5.2% | 3.0% | 3.7% | 13.8% | 7.4% | 1.9% | 4.1% |
| Other relative | 2.7% | 2.7% | 4.7% | 0.3% | 0.9% | 2.8% | 4.8% | 2.6% | 1.1% |
| Roomer, boarder, or foster child | 1.1% | 1.2% | 0.4% | 1.8% | 2.0% | 0.3% | 0.7% | 0.9% | 1.1% |
| Domestic worker/helper | 0.1% | 0.1% | 0% | 0% | 0.1% | 0.4% | 0.0% | 0% | 0.3% |
| Unmarried partner | 1.9% | 1.8% | 1.6% | 1.8% | 1.8% | 0.8% | 2.5% | 2.8% | 3.3% |
| Other nonrelative | 2.1% | 2.1% | 1.5% | 1.2% | 1.8% | 3.9% | 3.9% | 2.8% | 1.0% |
LFS 2017 Table P2.1 Relationship by Island and by District: CNMI 2017 Fourth Qtr. (Distribution Among)
| Relationship | CNMI Total |
Saipan Total |
Saipan Dist. 1 |
Saipan Dist. 2 |
Saipan Dist. 3 |
Saipan Dist. 4 |
Saipan Dist. 5 |
Tinian Dist. 6 |
Rota Dist. 7 |
|---|---|---|---|---|---|---|---|---|---|
| Source: Labor Force Survey CNMI, 2017 4th Qrt. | |||||||||
| Householder | 100% | 89.9% | 25.8% | 12.2% | 33.1% | 6.5% | 12.3% | 5.4% | 4.6% |
| Spouse | 100% | 90.6% | 27.0% | 13.7% | 30.4% | 6.8% | 12.7% | 5.6% | 3.8% |
| Natural or adopted son/daughter | 100% | 91.5% | 29.1% | 14.1% | 27.6% | 7.3% | 13.4% | 4.8% | 3.6% |
| Stepson/stepdaughter | 100% | 97.9% | 14.6% | 0.0% | 42.4% | 0.0% | 40.9% | 2.1% | 0.0% |
| Brother/sister | 100% | 93.2% | 31.5% | 15.0% | 20.6% | 1.6% | 24.5% | 3.8% | 2.9% |
| Father/mother | 100% | 87.3% | 30.5% | 17.8% | 20.9% | 0.0% | 18.0% | 4.1% | 8.7% |
| Grandchild | 100% | 95.0% | 27.6% | 7.1% | 20.4% | 19.7% | 20.2% | 1.9% | 3.1% |
| Other relative | 100% | 93.5% | 48.6% | 1.5% | 9.9% | 8.0% | 25.5% | 4.9% | 1.6% |
| Roomer, boarder, or foster child | 100% | 92.3% | 9.7% | 19.3% | 51.9% | 2.1% | 9.3% | 3.8% | 3.9% |
| Domestic worker/helper | 100% | 85.5% | 0.0% | 0.0% | 47.9% | 37.6% | 0.0% | 0.0% | 14.5% |
| Unmarried partner | 100% | 85.7% | 23.8% | 11.8% | 27.9% | 3.1% | 19.0% | 7.3% | 7.0% |
| Other nonrelative | 100% | 91.5% | 19.6% | 6.9% | 25.3% | 13.7% | 26.1% | 6.5% | 1.9% |
Population Characteristics
To download, right click on the chart and select “Save Image As”…