Labor Force Participation Survey 2017 Population Characteristics
CNMI Total
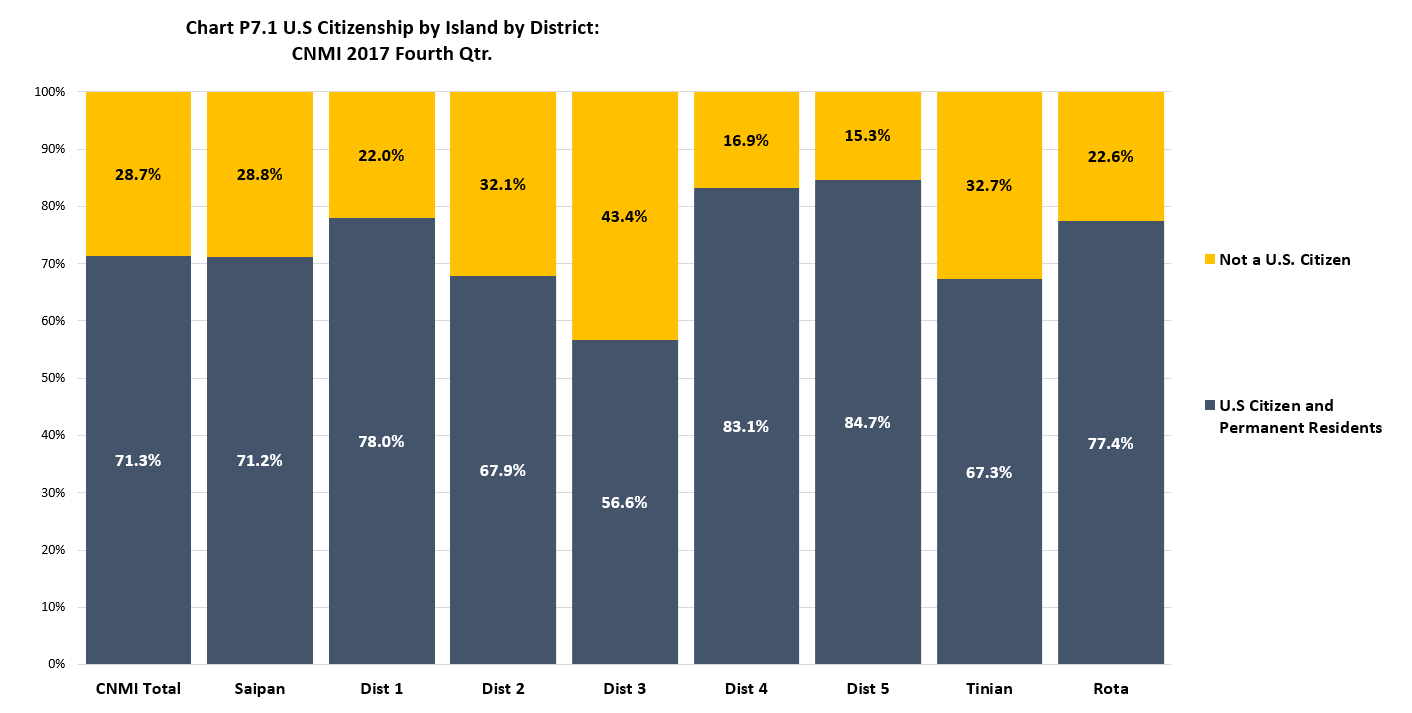
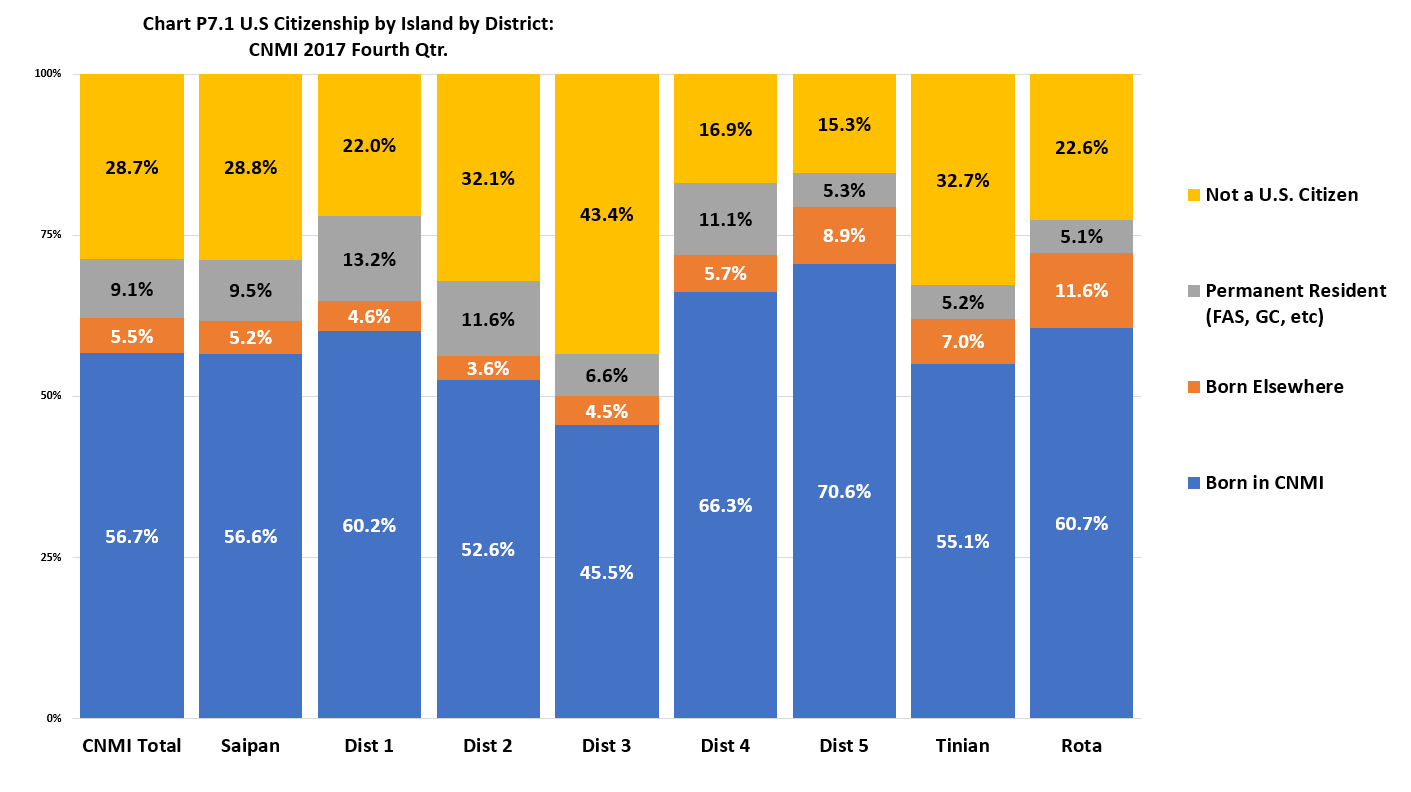
The U.S. Citizen and permanent resident was 71.1% of the total population in the CNMI in 2017 while the not a U.S. Citizen was 28.7%. The U.S Citizens born in the CNMI was 56.7%, the U.S Citizen born elsewhere was 5.5% while permanent resident was 9.1% of the total population.
By Island
The percentage of U.S. Citizen and permanent resident was higher in Rota (77.4%) than in Saipan (71.2%) and in Tinian (67.3%). Similarly, U.S. Citizen born in the CNMI’s percentage was higher in Rota (60.7%) than in Saipan (56.6%) and in Tinian (55.1%). The permanent resident’s percentage was relatively higher in Saipan (9.5%) compared to Tinian (5.2%) and Rota (5.1%). The not a U.S. Citizen percentage was higher in Tinian (32.7%) than in Saipan (28.8%), and in Rota (22.6%).
By Saipan Districts
The U.S. Citizen and permanent resident’s percentage was highest in District 5 (84.7%) and lowest in District 3 (56.6%). The U.S. Citizen born in the CNMI’s percentage was highest in District 5 (70.6%) and lowest in District 3 (45.5%). The permanent resident’s percentage was highest in District 1 (13.2%) and lowest in District 5 (5.3%). The not a U.S. Citizen percentage was highest in District 3 (43.4%) and lowest in District 5 (15.3%).
Population Characteristics
LFS 2017 Table P7.1 U.S. Citizenship by Island and by District: CNMI 2017 Fourth Qtr.
| Citizenship | CNMI Total |
Saipan Total |
Saipan Dist. 1 |
Saipan Dist. 2 |
Saipan Dist. 3 |
Saipan Dist. 4 |
Saipan Dist. 5 |
Tinian Dist. 6 |
Rota Dist. 7 |
|---|---|---|---|---|---|---|---|---|---|
| Source: Labor Force Survey CNMI, 2017 4th Qrt. | |||||||||
| Born in CNMI | 29,618 | 26,914 | 8,674 | 3,456 | 6,931 | 2,580 | 5,273 | 1,446 | 1,258 |
| Born Elsewhere | 2,890 | 2,467 | 659 | 239 | 684 | 223 | 662 | 183 | 240 |
| Permanent Resident (FAS, GC, etc) |
4,741 | 4,497 | 1,907 | 761 | 1,003 | 434 | 393 | 138 | 106 |
| Not a U.S. Citizen | 15,014 | 13,686 | 3,176 | 2,110 | 6,600 | 656 | 1,144 | 859 | 468 |
LFS 2017 Table P7.1 U.S. Citizenship by Island and by District: CNMI 2017 Fourth Qtr. (Distribution Within)
| Citizenship | CNMI Total |
Saipan Total |
Saipan Dist. 1 |
Saipan Dist. 2 |
Saipan Dist. 3 |
Saipan Dist. 4 |
Saipan Dist. 5 |
Tinian Dist. 6 |
Rota Dist. 7 |
|---|---|---|---|---|---|---|---|---|---|
| Source: Labor Force Survey CNMI, 2017 4th Qrt. | |||||||||
| Born in CNMI | 56.70% | 56.60% | 60.20% | 52.60% | 45.50% | 66.30% | 70.60% | 55.10% | 60.70% |
| Born Elsewhere | 5.50% | 5.20% | 4.60% | 3.60% | 4.50% | 5.70% | 8.90% | 7.00% | 11.60% |
| Permanent Resident (FAS, GC, etc) |
9.10% | 9.50% | 13.20% | 11.60% | 6.60% | 11.10% | 5.30% | 5.20% | 5.10% |
| Not a U.S. Citizen | 28.70% | 28.80% | 22.00% | 32.10% | 43.40% | 16.90% | 15.30% | 32.70% | 22.60% |
LFS 2017 Table P7.1 U.S. Citizenship by Island and by District: CNMI 2017 Fourth Qtr. (Distribution Amoung)
| Citizenship | CNMI Total |
Saipan Total |
Saipan Dist. 1 |
Saipan Dist. 2 |
Saipan Dist. 3 |
Saipan Dist. 4 |
Saipan Dist. 5 |
Tinian Dist. 6 |
Rota Dist. 7 |
|---|---|---|---|---|---|---|---|---|---|
| Source: Labor Force Survey CNMI, 2017 4th Qrt. | |||||||||
| Born in CNMI | 100% | 90.90% | 29.30% | 11.70% | 23.40% | 8.70% | 17.80% | 4.90% | 4.20% |
| Born Elsewhere | 100% | 85.40% | 22.80% | 8.30% | 23.70% | 7.70% | 22.90% | 6.30% | 8.30% |
| Permanent Resident (FAS, GC, etc) |
100% | 94.90% | 40.20% | 16.10% | 21.20% | 9.10% | 8.30% | 2.90% | 2.20% |
| Not a U.S. Citizen | 100% | 91.20% | 21.20% | 14.10% | 44.00% | 4.40% | 7.60% | 5.70% | 3.10% |
Population Characteristics
To download, right click on the chart and select “Save Image As”…