Labor Force Participation Survey 2017 Population Characteristics
DescriptionTable DataCharts and Figures Data
CNMI Total
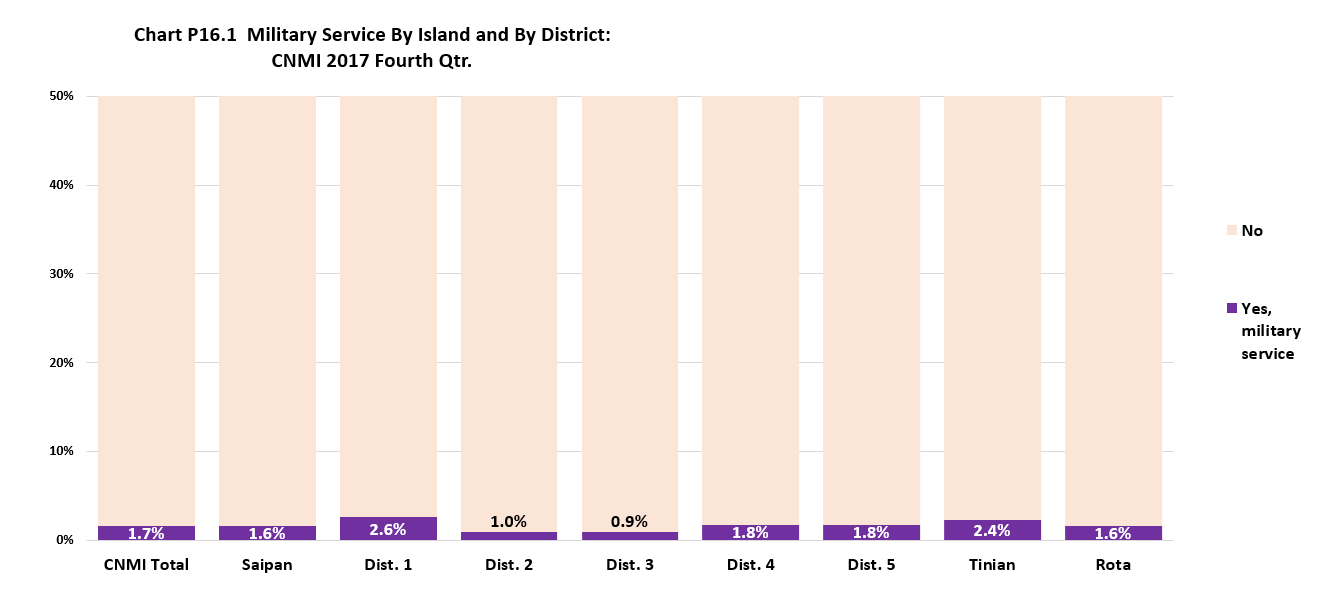
Persons with military service was 1.7% of the CNMI’s total population in 2017.
By Island
The persons with military service percentage was higher in Tinian (2.4%) than in Saipan (1.6%) and in Rota (1.6%).
By Saipan Districts
The persons with military service percentage was highest District 1 (2.6%) and lowest in District 3 (0.9%).
Population Characteristics
LFS 2017 Table P16.0 U.S Military Service by Island and by District: CNMI 2017 Fourth Qtr.
| Military Service | CNMI Total |
Saipan Total |
Saipan Dist. 1 |
Saipan Dist. 2 |
Saipan Dist. 3 |
Saipan Dist. 4 |
Saipan Dist. 5 |
Tinian Dist. 6 |
Rota Dist. 7 |
|---|---|---|---|---|---|---|---|---|---|
| Universe: 18 yrs and over | Source: Labor Force Survey CNMI, 2017 4th Qrt. | ||||||||
| Yes, military service | 593 | 527 | 254 | 40 | 94 | 46 | 93 | 42 | 23 |
| No | 34,675 | 31,503 | 9,448 | 4,154 | 10,183 | 2,552 | 5,166 | 1,744 | 1,428 |
LFS 2017 Table P16.0 U.S Military Service by Island and by District: CNMI 2017 Fourth Qtr. (Distribution Within)
| Military Service | CNMI Total |
Saipan Total |
Saipan Dist. 1 |
Saipan Dist. 2 |
Saipan Dist. 3 |
Saipan Dist. 4 |
Saipan Dist. 5 |
Tinian Dist. 6 |
Rota Dist. 7 |
|---|---|---|---|---|---|---|---|---|---|
| Universe: 18 yrs and over | Source: Labor Force Survey CNMI, 2017 4th Qrt. | ||||||||
| Yes, military service | 1.70% | 1.60% | 2.60% | 1.00% | 0.90% | 1.80% | 1.80% | 2.40% | 1.60% |
| No | 98.30% | 98.40% | 97.40% | 99.00% | 99.10% | 98.20% | 98.20% | 97.60% | 98.40% |
LFS 2017 Table P16.0 U.S Military Service by Island and by District: CNMI 2017 Fourth Qtr. (Distribution Amoung)
| Military Service | CNMI Total |
Saipan Total |
Saipan Dist. 1 |
Saipan Dist. 2 |
Saipan Dist. 3 |
Saipan Dist. 4 |
Saipan Dist. 5 |
Tinian Dist. 6 |
Rota Dist. 7 |
|---|---|---|---|---|---|---|---|---|---|
| Universe: 18 yrs and over | Source: Labor Force Survey CNMI, 2017 4th Qrt. | ||||||||
| Yes, military service | 100% | 89.00% | 42.90% | 6.80% | 15.80% | 7.80% | 15.80% | 7.10% | 3.90% |
| No | 100% | 90.90% | 27.20% | 12.00% | 29.40% | 7.40% | 14.90% | 5.00% | 4.10% |
Population Characteristics
To download, right click on the chart and select “Save Image As”…