Labor Force Participation Survey 2017 Population Characteristics
CNMI Total
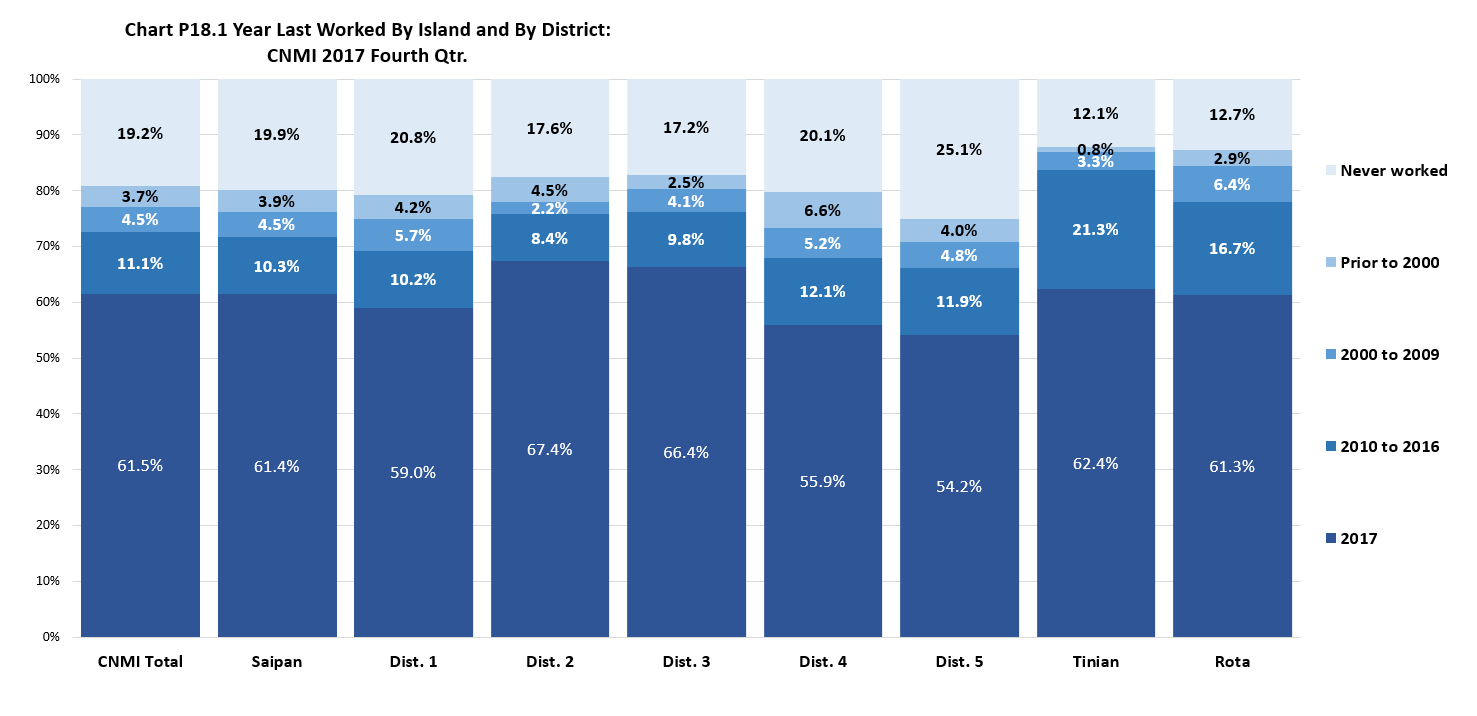
Persons that have ever worked, even just for a few days, was 80.8% of the 16 years and over population in the CNMI in 2017. Persons that worked in 2017 was 61.5% of the 16 years and over population in 2017. Persons that last worked in years between 2010 to 2016 was 11.1%; persons that last worked in years between 2000 to 2009 was 4.5%; while persons that last worked in years prior to 2000 was 3.7%. Persons that never worked was 19.2% of the 16 years and over population.
By Island
The percentage of persons that worked even for just a few days was higher in Tinian (87.9%) and in Rota (87.3%) and relatively lower in Saipan (80.1%). The percentage that last worked in 2017 was practically the same in the three islands: Tinian (62.4%), Saipan (61.5%), and Rota (61.3%). The percentage that last worked in years between 2010 and 2016 was higher in Tinian (21.3%) than in Rota (16.7%) and in Saipan (10.3%). The percentage that last worked in years between 2000 and 2009 was higher in Rota (6.4%) than in Saipan (4.5%) and in Rota (3.3%). The percentage that last worked in years prior to 2000 was higher in Saipan (3.9%) than in Rota (2.9%) and in Tinian (0.8%). The percentage of persons that never worked was higher in Saipan (19.9%) than in Rota (12.7%) and Tinian (12.1%).
By Saipan Districts
The percentage of persons that worked even for just a few days ranged from 74.9% in District 5 to 82.8% in District 2. The percentage that last worked in 2017 was highest in District 3 (66.4%) and was lowest in District 5 (54.2%). The percentage that last worked in years between 2010 and 2016 was highest in District 4 (12.1%) and was lowest in District 2 (8.4%). The percentage that last worked in years between 2000 and 2009 was highest in District 1 (5.7%) and was lowest in District 2 (2.2%). The percentage that last worked in years prior to 2000 was highest in District 4 (6.6%) and was lowest in District 3 (2.5%). The percentage of persons that never worked ranged from 17.2% in District 3 to 25.1% in District 5.
Population Characteristics
LFS 2017 Table P18.1 Year Last Worked by Island and by District: CNMI 2017 Fourth Qtr.
| Year Last Worked | CNMI Total |
Saipan Total |
Saipan Dist. 1 |
Saipan Dist. 2 |
Saipan Dist. 3 |
Saipan Dist. 4 |
Saipan Dist. 5 |
Tinian Dist. 6 |
Rota Dist. 7 |
|---|---|---|---|---|---|---|---|---|---|
| Universe: 16 yrs and over | Source: Labor Force Survey CNMI, 2017 4th Qrt. | ||||||||
| Never worked | 7,194 | 6,771 | 2,127 | 780 | 1,891 | 547 | 1,426 | 228 | 195 |
| Worked | 30,225 | 27,230 | 8,082 | 3,646 | 9,071 | 2,167 | 4,264 | 1,646 | 1,349 |
| Prior to 2000 | 1,373 | 1,313 | 428 | 197 | 278 | 180 | 230 | 16 | 45 |
| 2000 to 2009 | 1,702 | 1,541 | 586 | 96 | 445 | 142 | 272 | 62 | 100 |
| 2010 to 2016 | 4,148 | 3,491 | 1,042 | 370 | 1,075 | 327 | 676 | 400 | 258 |
| 2017 | 23,002 | 20,886 | 6,025 | 2,983 | 7,273 | 1,518 | 3,086 | 1,169 | 947 |
LFS 2017 Table P18.1 Year Last Worked by Island and by District: CNMI 2017 Fourth Qtr. (Distribution Within)
| Year Last Worked | CNMI Total |
Saipan Total |
Saipan Dist. 1 |
Saipan Dist. 2 |
Saipan Dist. 3 |
Saipan Dist. 4 |
Saipan Dist. 5 |
Tinian Dist. 6 |
Rota Dist. 7 |
|---|---|---|---|---|---|---|---|---|---|
| Universe: 16 yrs and over | Source: Labor Force Survey CNMI, 2017 4th Qrt. | ||||||||
| Never worked | 19.20% | 19.90% | 20.80% | 17.60% | 17.20% | 20.10% | 25.10% | 12.10% | 12.70% |
| Worked | 80.80% | 80.10% | 79.20% | 82.40% | 82.80% | 79.90% | 74.90% | 87.90% | 87.30% |
| Prior to 2000 | 3.70% | 3.90% | 4.20% | 4.50% | 2.50% | 6.60% | 4.00% | 0.80% | 2.90% |
| 2000 to 2009 | 4.50% | 4.50% | 5.70% | 2.20% | 4.10% | 5.20% | 4.80% | 3.30% | 6.40% |
| 2010 to 2016 | 11.10% | 10.30% | 10.20% | 8.40% | 9.80% | 12.10% | 11.90% | 21.30% | 16.70% |
| 2017 | 61.50% | 61.40% | 59.00% | 67.40% | 66.40% | 55.90% | 54.20% | 62.40% | 61.30% |
LFS 2017 Table P18.1 Year Last Worked by Island and by District: CNMI 2017 Fourth Qtr. (Distribution Amoung)
| Year Last Worked | CNMI Total |
Saipan Total |
Saipan Dist. 1 |
Saipan Dist. 2 |
Saipan Dist. 3 |
Saipan Dist. 4 |
Saipan Dist. 5 |
Tinian Dist. 6 |
Rota Dist. 7 |
|---|---|---|---|---|---|---|---|---|---|
| Universe: 16 yrs and over | Source: Labor Force Survey CNMI, 2017 4th Qrt. | ||||||||
| Never worked | 100% | 94.10% | 29.60% | 10.80% | 26.30% | 7.60% | 19.80% | 3.20% | 2.70% |
| Worked | 100% | 90.10% | 26.70% | 12.10% | 30.00% | 7.20% | 14.10% | 5.40% | 4.50% |
| Prior to 2000 | 100% | 95.60% | 31.20% | 14.40% | 20.20% | 13.10% | 16.70% | 1.10% | 3.30% |
| 2000 to 2009 | 100% | 90.50% | 34.40% | 5.60% | 26.10% | 8.30% | 16.00% | 3.60% | 5.80% |
| 2010 to 2016 | 100% | 84.20% | 25.10% | 8.90% | 25.90% | 7.90% | 16.30% | 9.60% | 6.20% |
| 2017 | 100% | 90.80% | 26.20% | 13.00% | 31.60% | 6.60% | 13.40% | 5.10% | 4.10% |
Population Characteristics
To download, right click on the chart and select “Save Image As”…