DescriptionTable DataChart and Figure Data
Ch.1 POPULATION
Ch.1 POPULATION
SY 2017 Table 1.20A Male Householder-Spouse Marriages by Age and Northern Marianas Decent, CNMI: 2016
Statistical Yearbook 2017 CNMI CSD
Note: Population in numbers
| Chamorro/Carolinian | Both | Husband only | Wife only | Neither |
|---|---|---|---|---|
| Source: CNMI 2016 Household Income and Expenditures Survey Note: Population in numbers |
||||
| 20 to 24 | 17 | – | – | 17 |
| 25 to 29 | 17 | – | – | 112 |
| 30 to 34 | 42 | 26 | – | 121 |
| 35 to 39 | 86 | 95 | 25 | 208 |
| 40 to 44 | 122 | 69 | 8 | 592 |
| 45 to 49 | 173 | 139 | 43 | 645 |
| 50 to 54 | 166 | 156 | 52 | 643 |
| 55 to 59 | 166 | 165 | 43 | 383 |
| 60 to 64 | 157 | 138 | 25 | 235 |
| 65 to 69 | 52 | 34 | 16 | 182 |
| 70 to 74 | 34 | – | – | 87 |
| 75 to 79 | 52 | 34 | 8 | 52 |
| 80 to 84 | – | – | – | 17 |
| 85 plus | – | – | – | 34 |
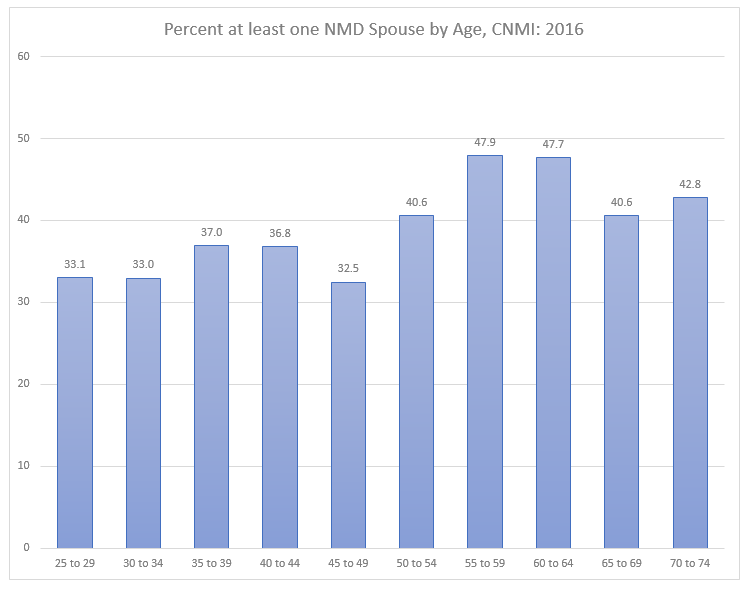
SY 2017 Table 1.20A Male Householder-Spouse Marriages by Age and Northern Marianas Decent, CNMI: 2016 (%)
Statistical Yearbook 2017 CNMI CSD
Note: Percentage
| Chamorro/Carolinian | Both | Husband only | Wife only | Neither |
|---|---|---|---|---|
| Source: CNMI 2016 Household Income and Expenditures Survey Note: Percentage |
||||
| 20 to 24 | 50.0% | 0% | 0% | 50.0% |
| 25 to 29 | 13.2% | 0% | 0% | 86.8% |
| 30 to 34 | 22.2% | 13.8% | 0% | 64.0% |
| 35 to 39 | 20.8% | 22.9% | 6.0% | 50.2% |
| 40 to 44 | 15.4% | 8.7% | 1.0% | 74.8% |
| 45 to 49 | 17.3% | 13.9% | 4.3% | 64.5% |
| 50 to 54 | 16.3% | 15.3% | 5.1% | 63.2% |
| 55 to 59 | 21.9% | 21.8% | 5.7% | 50.6% |
| 60 to 64 | 28.3% | 24.9% | 4.5% | 42.3% |
| 65 to 69 | 18.3% | 12.0% | 5.6% | 64.1% |
| 70 to 74 | 28.1% | 0% | 0% | 71.9% |
| 75 to 79 | 35.6% | 23.3% | 5.5% | 35.6% |
| 80 to 84 | 0% | 0% | 0% | 100% |
| 85 plus | 0% | 0% | 0% | 100% |
To download HD image, right click on image and select “Save Image As”…