DescriptionTable DataChart and Figure Data
Ch.1 POPULATION
Ch.1 POPULATION
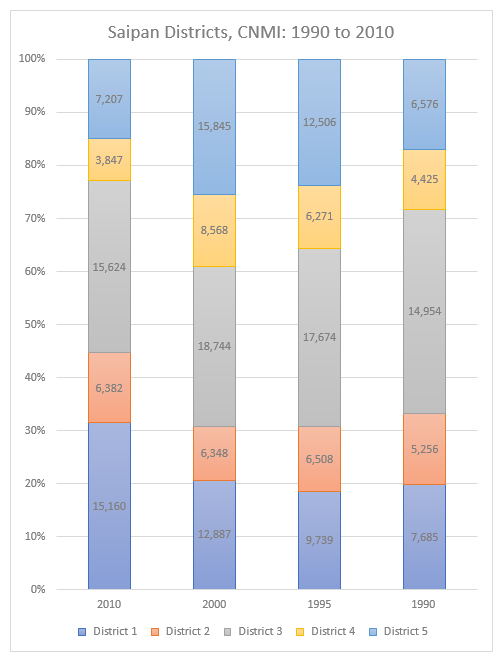
SY 2017 Table 1.3 Population by Island and District, CNMI: 1990, 1995, 2000 and 2010 (Numbers)
Statistical Yearbook 2017 CNMI CSD
Note: 2010 Districts determined by the courts; previous districts 2 to 5 now District 2, District 6 now District 1, District 9 now District 4, District 11 now District 3; Parts of Previous District 1 now in 1 and 2, District 8 now Districts 4 and 5 and District 10 now in Districts 1 and 5. So, numbers are estimates.
| 2010 | 2000 | 1995 | 1990 | ||
|---|---|---|---|---|---|
| Source: 1990 CPH-6-CNMI Table 3, 1995 Census Table 1 and 2000 and 2010 Censuses Note: 2010 Districts determined by the courts; previous districts 2 to 5 now District 2, District 6 now District 1, District 9 now District 4, District 11 now District 3; Parts of Previous District 1 now in 1 and 2, District 8 now Districts 4 and 5 and District 10 now in Districts 1 and 5. So, numbers are estimates. |
|||||
| Saipan | District 1 | 15,160 | 12,887 | 9,739 | 7,685 |
| Saipan | District 2 | 6,382 | 6,348 | 6,508 | 5,256 |
| Saipan | District 3 | 15,624 | 18,744 | 17,674 | 14,954 |
| Saipan | District 4 | 3,847 | 8,568 | 6,271 | 4,425 |
| Saipan | District 5 | 7,207 | 15,845 | 12,506 | 6,576 |
| Rota | District 7 | 2,527 | 3,283 | 3,509 | 2,295 |
| Tinian | District 6 | 3,136 | 3,540 | 2,631 | 2,118 |
| Northern Is. | 0 | 6 | 8 | 36 |
SY 2017 Table 1.3 Population by Island and District, CNMI: 1990, 1995, 2000 and 2010 (Percents)
Statistical Yearbook 2017 CNMI CSD
Note: 2010 Districts determined by the courts; previous districts 2 to 5 now District 2, District 6 now District 1, District 9 now District 4, District 11 now District 3; Parts of Previous District 1 now in 1 and 2, District 8 now Districts 4 and 5 and District 10 now in Districts 1 and 5. So, numbers are estimates.
| 2010 | 2000 | 1995 | 1990 | ||
|---|---|---|---|---|---|
| Source: 1990 CPH-6-CNMI Table 3, 1995 Census Table 1 and 2000 and 2010 Censuses Note: 2010 Districts determined by the courts; previous districts 2 to 5 now District 2, District 6 now District 1, District 9 now District 4, District 11 now District 3; Parts of Previous District 1 now in 1 and 2, District 8 now Districts 4 and 5 and District 10 now in Districts 1 and 5. So, numbers are estimates. |
|||||
| Saipan | District 1 | 28.1% | 18.6% | 16.5% | 17.7% |
| Saipan | District 2 | 11.8% | 9.2% | 11.1% | 12.1% |
| Saipan | District 3 | 29.0% | 27.1% | 30.0% | 34.5% |
| Saipan | District 4 | 7.1% | 12.4% | 10.7% | 10.2% |
| Saipan | District 5 | 13.4% | 22.9% | 21.3% | 15.2% |
| Rota | District 7 | 4.7% | 4.7% | 6.0% | 5.3% |
| Tinian | District 6 | 5.8% | 5.1% | 4.5% | 4.9% |
| Northern Is. | 0% | 0% | 0% | 0.1% |
To download HD image, right click on image and select “Save Image As”…