DescriptionTable DataChart and Figure Data
Ch.1 POPULATION
Ch.1 POPULATION
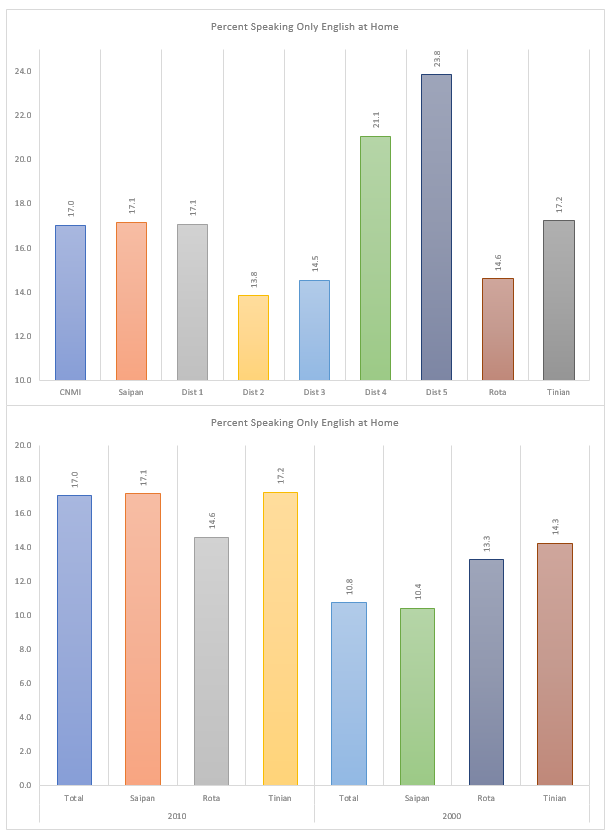
SY 2017 Table 1.38 Language Spoken at Home and Frequency of Language Usage by District and Island, CNMI: 2010
Statistical Yearbook 2017 CNMI CSD
Universe: Population 5 years and over
| Saipan District 1 |
Saipan District 2 |
Saipan District 3 |
Saipan District 4 |
Saipan District 5 |
Rota District 7 |
Tinian District 6 |
|
|---|---|---|---|---|---|---|---|
| Source: U.S. Census Bureau Universe: Population 5 years and over |
|||||||
| English only | 2,340 | 802 | 2,069 | 740 | 1,571 | 339 | 493 |
| Speak other language less frequently than English | 2,104 | 749 | 1,793 | 464 | 1,276 | 471 | 324 |
| Speak other language equally often as English | 3,897 | 1,672 | 3,699 | 1,113 | 1,726 | 691 | 678 |
| Speak other language more frequently than English | 5,007 | 2,435 | 6,480 | 1,183 | 1,974 | 814 | 1,161 |
| Does not speak English | 371 | 146 | 205 | 13 | 42 | 9 | 5 |
SY 2017 Table 1.39 Language Spoken at Home and Frequency of Language Usage by Island, CNMI: 2000 and 2010
Statistical Yearbook 2017 CNMI CSD
Universe: Population 5 years and over
| Saipan 2010 | Rota 2010 | Tinian 2010 | Saipan 2000 | Rota 2000 | Tinian 2000 | |
|---|---|---|---|---|---|---|
| Source: U.S. Census Bureau Universe: Population 5 years and over |
||||||
| English only | 7,522 | 339 | 493 | 5,973 | 387 | 459 |
| Speak other language less frequently than English | 6,386 | 471 | 324 | 4,470 | 460 | 376 |
| Speak other language equally often as English | 12,107 | 691 | 678 | 10,660 | 767 | 869 |
| Speak other language more frequently than English | 17,079 | 814 | 1,161 | 26,952 | 1,259 | 1,503 |
| Does not speak English | 777 | 9 | 5 | 9,234 | 42 | 12 |
To download HD image, right click on image and select “Save Image As”…