DescriptionTable DataChart and Figure Data
Ch.1 POPULATION
Ch.1 POPULATION
SY 2017 Table 1.6 Age Distribution by Island, CNMI: 1990 to 2010 (SPN)
Statistical Yearbook 2017 CNMI CSD
Note: Saipan Age Distribution: 1990 to 2010
| 2010 | 2000 | 1995 | 1990 | |
|---|---|---|---|---|
| Source: 1995 CNMI Mid-Decade Census Table 6, 1990, 2000 and 2010 CNMI Censuses Note: Saipan Age Distribution: 1990 to 2010 |
||||
| 0 to 4 | 4349 | 5103 | 5311 | 3591 |
| 5 to 9 | 4139 | 4703 | 4004 | 2817 |
| 10 to 14 | 4407 | 3801 | 3128 | 2498 |
| 15 to 19 | 3835 | 3512 | 2955 | 2494 |
| 20 to 24 | 2436 | 7190 | 5886 | 5179 |
| 25 to 29 | 2711 | 9766 | 8126 | 5608 |
| 30 to 34 | 3429 | 8763 | 7005 | 5326 |
| 35 to 39 | 4458 | 6340 | 5826 | 3944 |
| 40 to 44 | 5105 | 4989 | 3964 | 2803 |
| 45 to 49 | 4482 | 3335 | 2705 | 1744 |
| 50 to 54 | 3725 | 2157 | 1457 | 1144 |
| 55 to 59 | 2339 | 1088 | 959 | 706 |
| 60 to 64 | 1389 | 748 | 578 | 390 |
| 65 to 69 | 634 | 429 | 343 | 302 |
| 70 to 74 | 403 | 216 | 227 | 162 |
| 75 and over | 379 | 252 | 224 | 188 |
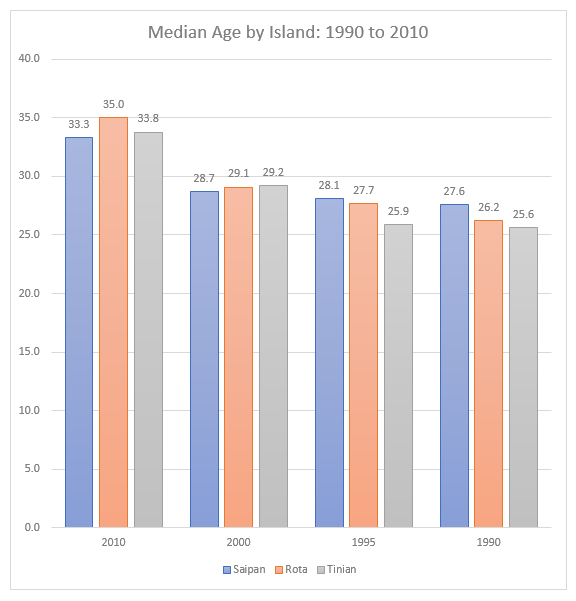
| Median | 33.3 | 28.7 | 28.1 | 27.6 |
SY 2017 Table 1.6 Age Distribution by Island, CNMI: 1990 to 2010 (ROT)
Statistical Yearbook 2017 CNMI CSD
Note: Rota Age Distribution: 1990 to 2010
| 2010 | 2000 | 1995 | 1990 | |
|---|---|---|---|---|
| Source: 1995 CNMI Mid-Decade Census Table 6, 1990, 2000 and 2010 CNMI Censuses Note: Rota Age Distribution: 1990 to 2010 |
||||
| 0 to 4 | 203 | 368 | 393 | 277 |
| 5 to 9 | 227 | 367 | 312 | 235 |
| 10 to 14 | 257 | 287 | 262 | 210 |
| 15 to 19 | 192 | 220 | 205 | 149 |
| 20 to 24 | 84 | 166 | 325 | 221 |
| 25 to 29 | 115 | 299 | 476 | 222 |
| 30 to 34 | 186 | 387 | 411 | 287 |
| 35 to 39 | 247 | 323 | 368 | 206 |
| 40 to 44 | 277 | 296 | 266 | 175 |
| 45 to 49 | 220 | 220 | 201 | 93 |
| 50 to 54 | 203 | 149 | 92 | 49 |
| 55 to 59 | 147 | 70 | 56 | 46 |
| 60 to 64 | 80 | 43 | 45 | 44 |
| 65 to 69 | 41 | 34 | 37 | 25 |
| 70 to 74 | 17 | 24 | 17 | 24 |
| 75 and over | 31 | 30 | 43 | 32 |
| Median | 35 | 29.1 | 27.7 | 26.2 |
SY 2017 Table 1.6 Age Distribution by Island, CNMI: 1990 to 2010 (TIN)
Statistical Yearbook 2017 CNMI CSD
Note: Tinian Age Distribution: 1990 to 2010
| 2010 | 2000 | 1995 | 1990 | |
|---|---|---|---|---|
| Source: 1995 CNMI Mid-Decade Census Table 6, 1990, 2000 and 2010 CNMI Censuses Note: Tinian Age Distribution: 1990 to 2010 |
||||
| 0 to 4 | 275 | 321 | 379 | 263 |
| 5 to 9 | 247 | 350 | 303 | 219 |
| 10 to 14 | 257 | 288 | 210 | 190 |
| 15 to 19 | 223 | 209 | 175 | 127 |
| 20 to 24 | 150 | 210 | 194 | 220 |
| 25 to 29 | 201 | 475 | 311 | 307 |
| 30 to 34 | 283 | 490 | 302 | 258 |
| 35 to 39 | 352 | 396 | 270 | 179 |
| 40 to 44 | 384 | 306 | 190 | 134 |
| 45 to 49 | 307 | 215 | 134 | 82 |
| 50 to 54 | 195 | 131 | 53 | 53 |
| 55 to 59 | 126 | 41 | 38 | 19 |
| 60 to 64 | 75 | 46 | 25 | 24 |
| 65 to 69 | 24 | 23 | 21 | 22 |
| 70 to 74 | 20 | 22 | 15 | 4 |
| 75 and over | 17 | 17 | 11 | 17 |
| Median | 33.8 | 29.2 | 25.9 | 25.6 |
To download HD image, right click on image and select “Save Image As”…