DescriptionTable DataChart and Figure Data
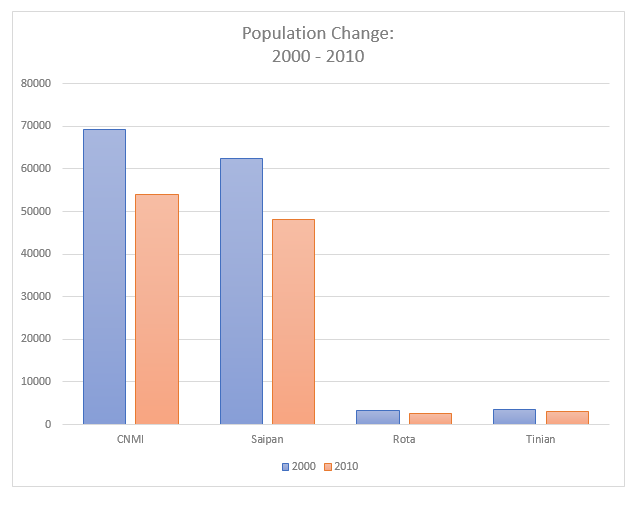
Ch.1 POPULATION
Ch.1 POPULATION
SY 2017 Table 1.7 Population Change by Age and Island: 2000 to 2010 (SPN)
Statistical Yearbook 2017 CNMI CSD
Note: Saipan Population Change: 1990 to 2010
| 2010 | 2,000 | Change | |
|---|---|---|---|
| Source: U.S. Census Bureau Note: Saipan Population Change: 1990 to 2010 |
|||
| Under 5 years | 4349 | 5103 | -14.8% |
| 5 to 9 years | 4139 | 4703 | -12% |
| 10 to 14 years | 4407 | 3801 | 15.9% |
| 15 to 19 years | 3835 | 3512 | 9.2% |
| 20 to 24 years | 2436 | 7190 | -66.1% |
| 25 to 29 years | 2711 | 9765 | -72.2% |
| 30 to 34 years | 3429 | 8762 | -60.9% |
| 35 to 39 years | 4458 | 6340 | -29.7% |
| 40 to 44 years | 5105 | 4989 | 2.3% |
| 45 to 49 years | 4482 | 3335 | 34.4% |
| 50 to 54 years | 3725 | 2157 | 72.7% |
| 55 to 59 years | 2339 | 1088 | 115% |
| 60 to 64 years | 1389 | 748 | 85.7% |
| 65 to 69 years | 634 | 429 | 47.8% |
| 70 to 74 years | 403 | 216 | 86.6% |
| 75 years and over | 379 | 252 | 50.4% |
SY 2017 Table 1.7 Population Change by Age and Island: 2000 to 2010 (ROT)
Statistical Yearbook 2017 CNMI CSD
Note: Rota Population Change: 1990 to 2010
| 2010 | 2,000 | Change | |
|---|---|---|---|
| Source: U.S. Census Bureau Note: Rota Population Change: 1990 to 2010 |
|||
| Under 5 years | 203 | 368 | -44.8% |
| 5 to 9 years | 227 | 367 | -38.1% |
| 10 to 14 years | 257 | 287 | -10.5% |
| 15 to 19 years | 192 | 220 | -12.7% |
| 20 to 24 years | 84 | 166 | -49.4% |
| 25 to 29 years | 115 | 300 | -61.7% |
| 30 to 34 years | 186 | 387 | -51.9% |
| 35 to 39 years | 247 | 323 | -23.5% |
| 40 to 44 years | 277 | 296 | -6.4% |
| 45 to 49 years | 220 | 220 | 0% |
| 50 to 54 years | 203 | 149 | 36.2% |
| 55 to 59 years | 147 | 70 | 110% |
| 60 to 64 years | 80 | 43 | 86% |
| 65 to 69 years | 41 | 34 | 20.6% |
| 70 to 74 years | 17 | 24 | -29.2% |
| 75 years and over | 31 | 30 | 3.3% |
SY 2017 Table 1.7 Population Change by Age and Island: 2000 to 2010 (TIN)
Statistical Yearbook 2017 CNMI CSD
Note: Tinian Population Change: 1990 to 2010
| 2010 | 2,000 | Change | |
|---|---|---|---|
| Source: U.S. Census Bureau Note: Tinian Population Change: 1990 to 2010 |
|||
| Under 5 years | 275 | 321 | -14.3% |
| 5 to 9 years | 247 | 350 | -29.4% |
| 10 to 14 years | 257 | 288 | -10.8% |
| 15 to 19 years | 223 | 209 | 6.7% |
| 20 to 24 years | 150 | 210 | -28.6% |
| 25 to 29 years | 201 | 475 | -57.7% |
| 30 to 34 years | 283 | 491 | -42.4% |
| 35 to 39 years | 352 | 396 | -11.1% |
| 40 to 44 years | 384 | 306 | 25.5% |
| 45 to 49 years | 307 | 215 | 43% |
| 50 to 54 years | 195 | 131 | 48.9% |
| 55 to 59 years | 126 | 41 | 207% |
| 60 to 64 years | 75 | 46 | 63% |
| 65 to 69 years | 24 | 23 | 4.3% |
| 70 to 74 years | 20 | 22 | -9.1% |
| 75 years and over | 17 | 17 | 0% |
To download HD image, right click on image and select “Save Image As”…