DescriptionTable DataChart and Figure Data
Ch.11 TRADE
Ch.11 TRADE
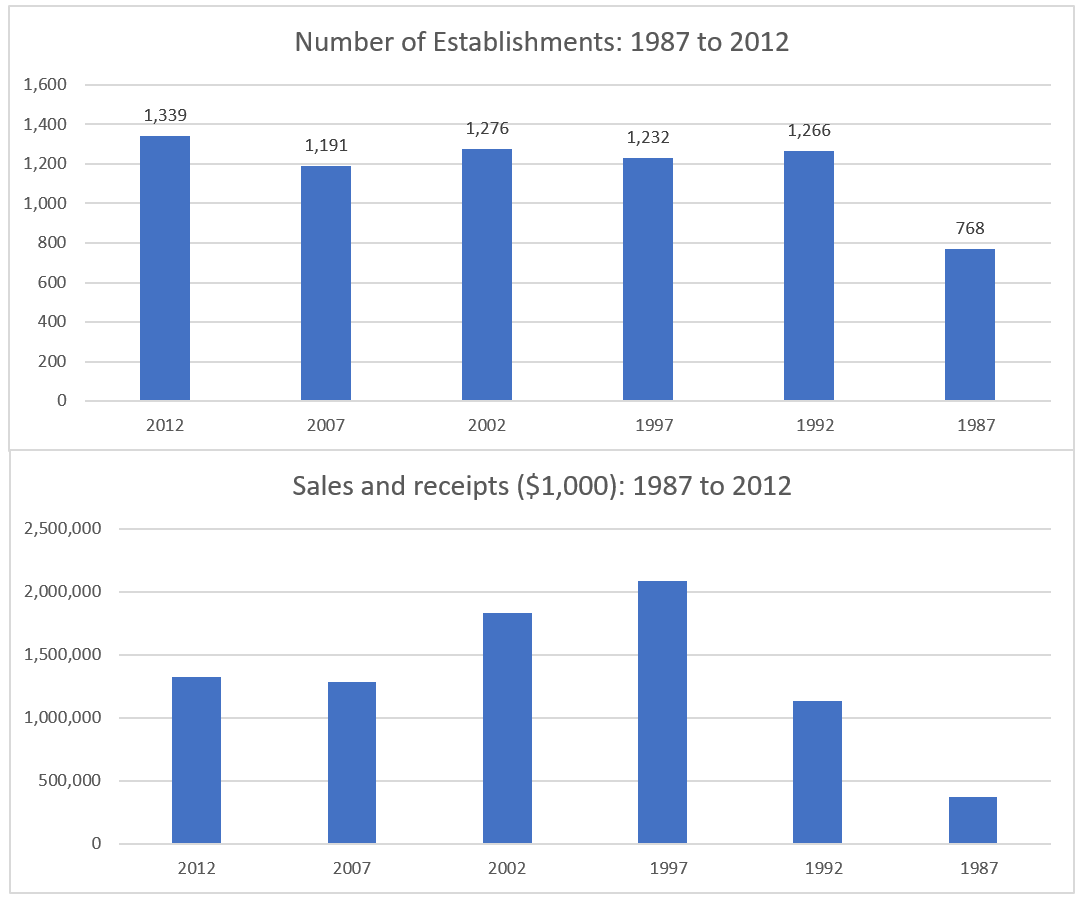
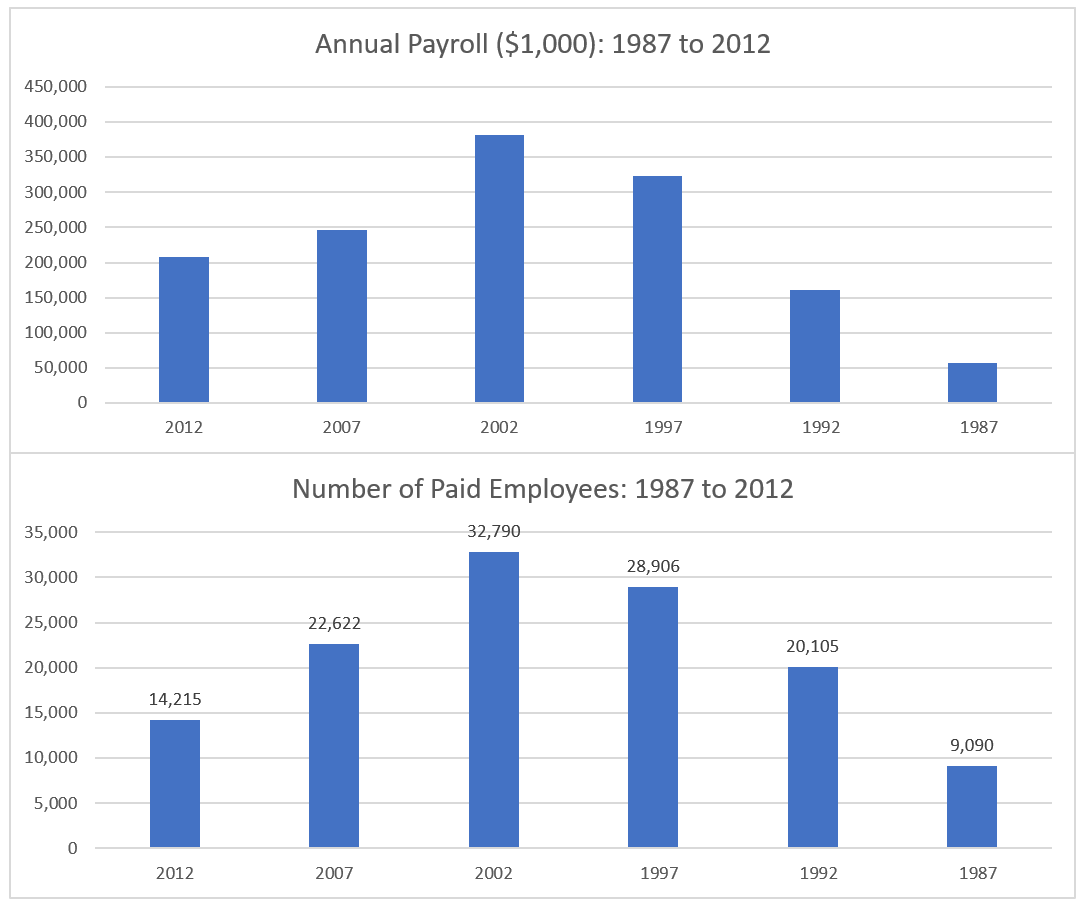
SY 2017 Table 11.1 General Statistics for Selected Industries, CNMI: 1987 to 2012 (TOTAL)
Statistical Yearbook 2017 CNMI CSD
| Number of Establishments | Sales and receipts ($1,000) | Annual Payroll ($1,000) | Number of paid Employees | |
|---|---|---|---|---|
| Source: CNMI Economic Censuses | ||||
| 2012 | 1,339 | 1,323,742 | 208,434 | 14,215 |
| 2007 | 1,191 | 1,284,188 | 246,113 | 22,622 |
| 2002 | 1,276 | 1,832,130 | 381,575 | 32,790 |
| 1997 | 1,232 | 2,082,740 | 323,069 | 28,906 |
| 1992 | 1,266 | 1,132,039 | 161,184 | 20,105 |
| 1987 | 768 | 373,946 | 57,311 | 9,090 |
SY 2017 Table 11.1 General Statistics for Selected Industries, CNMI: 1987 to 2012
Statistical Yearbook 2017 CNMI CSD
| Sector | Year | Number of Establishments |
Sales and receipts ($1,000) |
Annual Payroll ($1,000) |
Number of paid Employees |
|---|---|---|---|---|---|
| Source: CNMI Economic Censuses | |||||
| Construction | 2012 | 62 | 37,230 | 7,707 | 821 |
| Construction | 2007 | 50 | 31,398 | 6,844 | 528 |
| Construction | 2002 | 63 | 50,008 | 11,276 | 1,013 |
| Construction | 1997 | 85 | 87,942 | 21,471 | 2,302 |
| Construction | 1992 | 103 | 87,602 | 17,712 | 3,036 |
| Construction | 1987 | 72 | 43,488 | 11,572 | 2,061 |
| Manufacturing | 2012 | 39 | 20,887 | 6,700 | 592 |
| Manufacturing | 2007 | 59 | 189,715 | 56,565 | 7,094 |
| Manufacturing | 2002 | 78 | 665,774 | 184,706 | 16,941 |
| Manufacturing | 1997 | 84 | 762,080 | 146,583 | 13,715 |
| Manufacturing | 1992 | 73 | 264,467 | 48,652 | 6,267 |
| Manufacturing | 1987 | 39 | 58,138 | 14,495 | 2,257 |
| Wholesale Trade | 2012 | 74 | 246,827 | 10,746 | 716 |
| Wholesale Trade | 2007 | 72 | 142,929 | 10,044 | 872 |
| Wholesale Trade | 2002 | 78 | 122,634 | 8,820 | 849 |
| Wholesale Trade | 1997 | 57 | 222,655 | 9,417 | 745 |
| Wholesale Trade | 1992 | 60 | 132,095 | 5,877 | 534 |
| Wholesale Trade | 1987 | 28 | 49,746 | 1,598 | 187 |
| Retail Trade | 2012 | 284 | 314,066 | 30,662 | 2,463 |
| Retail Trade | 2007 | 255 | 271,763 | 28,578 | 2,770 |
| Retail Trade | 2002 | 297 | 312,384 | 29,309 | 2,916 |
| Retail Trade | 1997 | 519 | 570,266 | 54,186 | 4,811 |
| Retail Trade | 1992 | 616 | 384,354 | 37,969 | 4,715 |
| Retail Trade | 1987 | 383 | 155,378 | 14,138 | 2,304 |
| Service Industries and others | 2012 | 880 | 704,732 | 152,619 | 9,623 |
| Service Industries and others | 2007 | 755 | 648,383 | 144,082 | 11,358 |
| Service Industries and others | 2002 | 760 | 681,330 | 147,464 | 11,071 |
| Service Industries and others | 1997 | 457 | 439,797 | 91,412 | 7,333 |
| Service Industries and others | 1992 | 414 | 263,521 | 50,974 | 5,553 |
| Service Industries and others | 1987 | 246 | 67,196 | 15,508 | 2,281 |
Ch.11 TRADE
To download, right click the chart and select “Save Image As”…