DescriptionTable DataChart and Figure Data
Ch.11 TRADE
Ch.11 TRADE
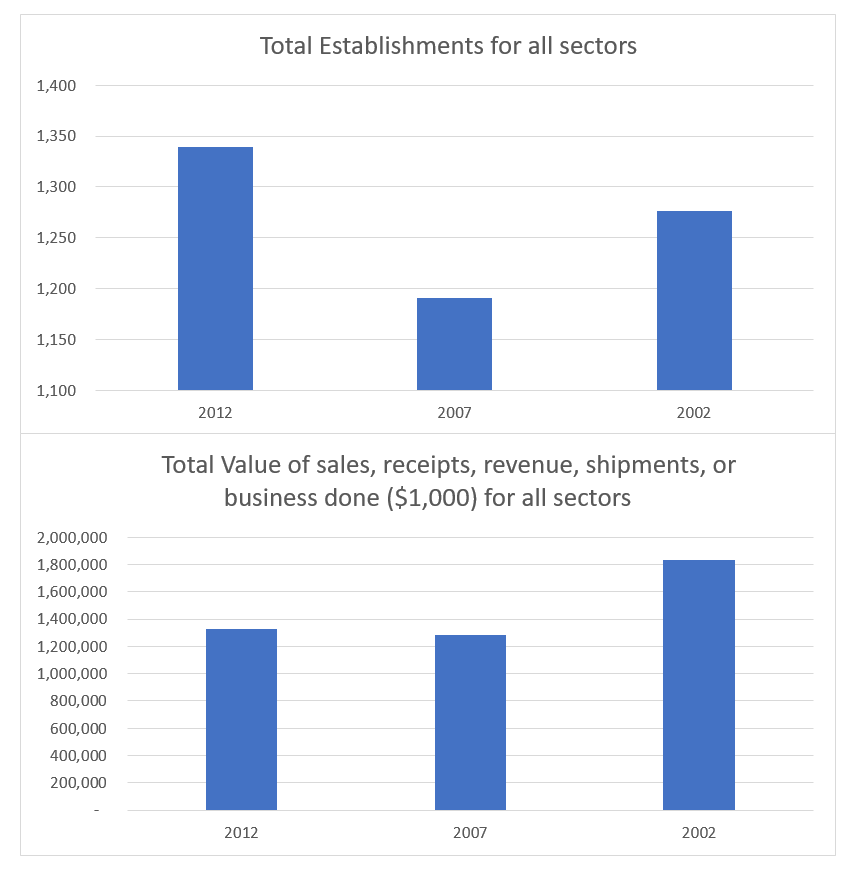
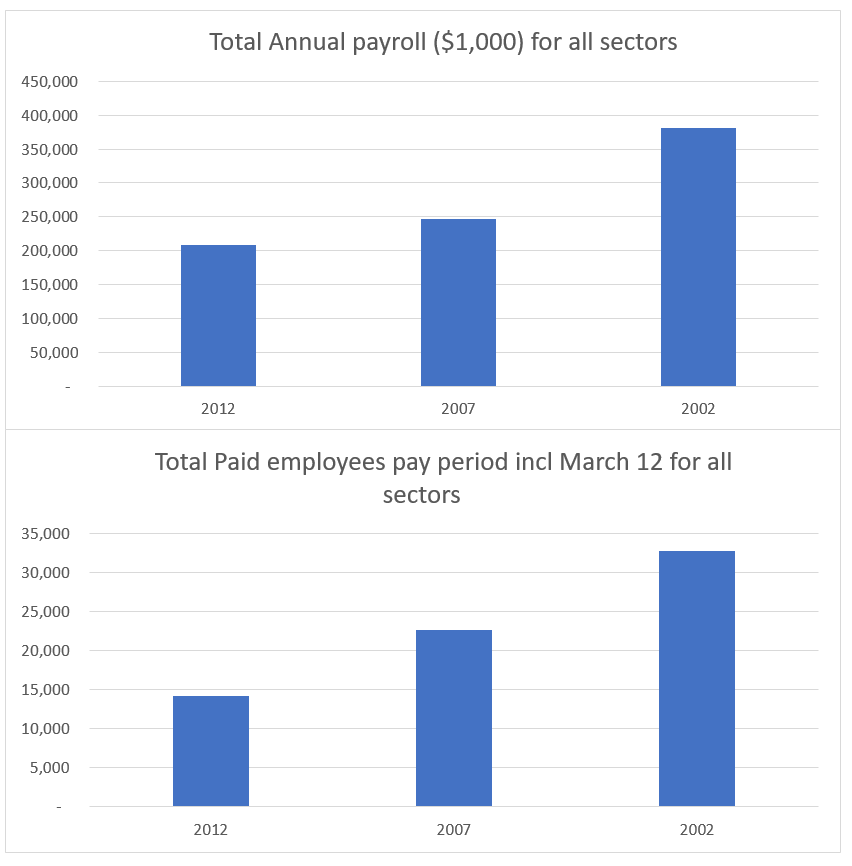
SY 2017 Table 11.2 Comparative Staistics by Type of Business, CNMI: 2012
Statistical Yearbook 2017 CNMI CSD
“D”: Withheld to avoid disclosing data for individual companies; data are included in higher level totals
“b”: 20 to 99 employees
“c”: 0 to 19 employees
“d”: 250 to 499 employees
| Industry 2012 | Establishments | Value of sales, receipts, revenue, shipments, or business done ($1,000) | Annual payroll ($1,000) | Paid employees pay period incl March 12 |
|---|---|---|---|---|
| Source: U.S. Census Bureau, 2002, 2007 and 2012 Economic Census of Island Areas | ||||
| Mining, quarrying, and oil and gas extraction | 1 | D | D | b |
| Utilities | 6 | D | D | e |
| Construction | 62 | 37,230 | 7,707 | 821 |
| Manufacturing | 39 | 20,887 | 6,700 | 592 |
| Wholesale trade | 74 | 246,827 | 10,746 | 716 |
| Retail trade | 284 | 314,066 | 30,662 | 2,463 |
| Transportation and warehousing | 26 | 46,438 | 11,387 | 641 |
| Information | 20 | 25,138 | 8,384 | 323 |
| Finance and insurance | 47 | 57,560 | 8,559 | 327 |
| Real estate and rental and leasing | 177 | 30,675 | 8,305 | 694 |
| Professional, scientific, and technical services | 105 | 28,703 | 9,710 | 602 |
| Management of companies and enterprises | 4 | D | D | b |
| Administrative and support and waste management and remediation services | 115 | 50,913 | 17,689 | 1,396 |
| Educational services | 43 | 4,979 | 1,582 | 133 |
| Health care and social assistance | 36 | 41,349 | 19,656 | 725 |
| Arts, entertainment, and recreation | 43 | 37,467 | 7,160 | 497 |
| Accommodation and food services | 142 | 179,975 | 37,761 | 3,195 |
| Other services (except public administration) | 115 | 20,636 | 6,517 | 576 |
SY 2017 Table 11.2 Comparative Staistics by Type of Business, CNMI: 2007
Statistical Yearbook 2017 CNMI CSD
“D”: Withheld to avoid disclosing data for individual companies; data are included in higher level totals
“b”: 20 to 99 employees
“c”: 0 to 19 employees
“d”: 250 to 499 employees
| Industry 2007 | Establishments | Value of sales, receipts, revenue, shipments, or business done ($1,000) | Annual payroll ($1,000) | Paid employees pay period incl March 12 |
|---|---|---|---|---|
| Source: U.S. Census Bureau, 2002, 2007 and 2012 Economic Census of Island Areas | ||||
| Mining, quarrying, and oil and gas extraction | 1 | D | D | a |
| Utilities | 4 | D | D | e |
| Construction | 50 | 31,398 | 6,844 | 528 |
| Manufacturing | 59 | 189,715 | 56,565 | 7,094 |
| Wholesale trade | 72 | 142,929 | 10,044 | 872 |
| Retail trade | 255 | 271,763 | 28,578 | 2,770 |
| Transportation and warehousing | 59 | 50,178 | 15,636 | 1,105 |
| Information | 24 | 66,968 | 12,884 | 604 |
| Finance and insurance | 60 | 97,436 | 12,769 | 536 |
| Real estate and rental and leasing | 109 | 30,649 | 7,854 | 637 |
| Professional, scientific, and technical services | 87 | 24,961 | 8,685 | 404 |
| Management of companies and enterprises | 5 | D | D | b |
| Administrative and support and waste management and remediation services | 75 | 41,185 | 15,611 | 1,358 |
| Educational services | 44 | 3,567 | 1,215 | 136 |
| Health care and social assistance | 32 | 13,842 | 4,427 | 267 |
| Arts, entertainment, and recreation | 48 | 22,602 | 5,854 | 580 |
| Accommodation and food services | 140 | 172,682 | 44,806 | 4,772 |
| Other services (except public administration) | 67 | 17,388 | 5,190 | 547 |
SY 2017 Table 11.2 Comparative Staistics by Type of Business, CNMI: 2002
Statistical Yearbook 2017 CNMI CSD
“D”: Withheld to avoid disclosing data for individual companies; data are included in higher level totals
“b”: 20 to 99 employees
“c”: 0 to 19 employees
“d”: 250 to 499 employees
| Industry 2002 | Establishments | Value of sales, receipts, revenue, shipments, or business done ($1,000) | Annual payroll ($1,000) | Paid employees pay period incl March 12 |
|---|---|---|---|---|
| Source: U.S. Census Bureau, 2002, 2007 and 2012 Economic Census of Island Areas | ||||
| Mining, quarrying, and oil and gas extraction | 3 | D | D | b |
| Utilities | 2 | D | D | e |
| Construction | 63 | 50,008 | 11,276 | 1,013 |
| Manufacturing | 78 | 665,774 | 184,706 | 16,941 |
| Wholesale trade | 78 | 122,634 | 8,820 | 849 |
| Retail trade | 297 | 312,384 | 29,309 | 2,916 |
| Transportation and warehousing | 48 | 58,361 | 13,816 | 919 |
| Information | 21 | 48,486 | 6,650 | 306 |
| Finance and insurance | 54 | 53,748 | 8,409 | 419 |
| Real estate and rental and leasing | 108 | 27,499 | 6,266 | 573 |
| Professional, scientific, and technical services | 93 | 30,819 | 7,658 | 373 |
| Management of companies and enterprises | 4 | 31,844 | 514 | 21 |
| Administrative and support and waste management and remediation services | 83 | 72,024 | 25,908 | 2,001 |
| Educational services | 31 | D | D | c |
| Health care and social assistance | 26 | 15,568 | 3,666 | 194 |
| Arts, entertainment, and recreation | 45 | 29,316 | 6,418 | 662 |
| Accommodation and food services | 151 | 197,187 | 47,275 | 4,304 |
| Other services (except public administration) | 91 | 35,738 | 7,563 | 773 |
Ch.11 TRADE
To download, right click the chart and select “Save Image As”…