Ch.11 TRADE
Ch.11 TRADE
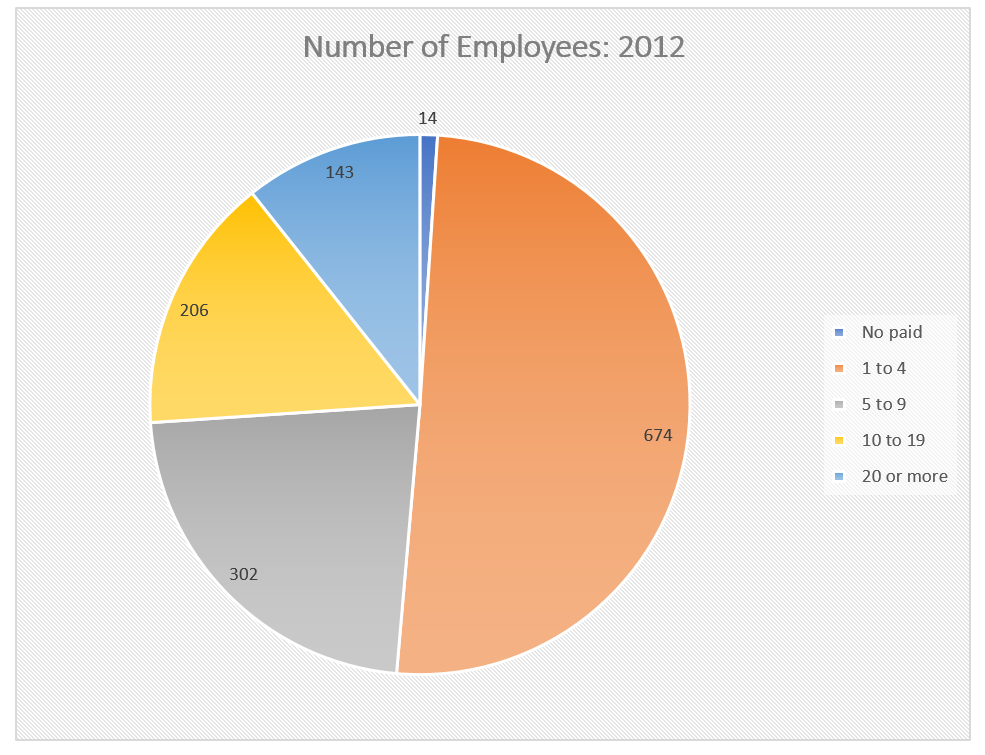
SY 2017 Table 11.6 Employment Size by Sector, CNMI: 2012 (TOTAL)
Statistical Yearbook 2017 CNMI CSD
“N”: Not available or not comparable
“X”: Not applicable (for the Commodity Flow Survey, not applicable or comparison data unavailable).
“S”: Withheld because estimate did not meet publication standards.
“D”: Withheld to avoid disclosing data for individual companies; data are included in higher level totals
“f”: 500 to 999 employees
“e”: 250 to 499 employees
“b”: 20 to 99 employees
“a”: 0 to 19 employees
“c”: 100 to 249 employees
| Number of Employees | Number of establishments | Value of sales, receipts, revenue, shipments, or business done ($1,000) | Annual payroll ($1,000) | First-quarter payroll ($1,000) | Paid employees for pay period including March 12 (number) | Operating expenses ($1,000) | Total inventories, beginning-of-year ($1,000) | Total inventories, end-of-year ($1,000) |
|---|---|---|---|---|---|---|---|---|
| Source: U.S. Census Bureau, 2012 Economic Census of Island Areas | ||||||||
| No paid | 14 | 1,276 | 326 | 29 | 0 | 1,098 | X | X |
| 1 to 4 | 674 | 93,275 | 18,556 | 4,550 | 1,489 | 52,000 | X | X |
| 5 to 9 | 302 | 155,803 | 26,572 | 6,483 | 2,003 | 67,917 | X | X |
| 10 to 19 | 206 | 269,194 | 37,473 | 9,333 | 2,743 | 107,451 | X | X |
| 20 or more | 143 | 804,193 | 125,506 | 31,492 | 7,977 | 424,934 | X | X |
SY 2017 Table 11.6 Employment Size by Sector, CNMI: 2012
Statistical Yearbook 2017 CNMI CSD
“N”: Not available or not comparable
“X”: Not applicable (for the Commodity Flow Survey, not applicable or comparison data unavailable).
“S”: Withheld because estimate did not meet publication standards.
“D”: Withheld to avoid disclosing data for individual companies; data are included in higher level totals
“f”: 500 to 999 employees
“e”: 250 to 499 employees
“b”: 20 to 99 employees
“a”: 0 to 19 employees
“c”: 100 to 249 employees
| Sector | Number of Employees | Number of establishments | Value of sales, receipts, revenue, shipments, or business done ($1,000) | Annual payroll ($1,000) | First-quarter payroll ($1,000) | Paid employees for pay period including March 12 (number) | Operating expenses ($1,000) | Total inventories, beginning-of-year ($1,000) | Total inventories, end-of-year ($1,000) |
|---|---|---|---|---|---|---|---|---|---|
| Source: U.S. Census Bureau, 2012 Economic Census of Island Areas | |||||||||
| Construction | No paid | 0 | 0 | 0 | 0 | 0 | 0 | 0 | 0 |
| Construction | 1 to 4 | 30 | 3,269 | 841 | 178 | 66 | 1,971 | 1,146 | 737 |
| Construction | 5 to 9 | 9 | 2,168 | 527 | 132 | 61 | 1,259 | 428 | 369 |
| Construction | 10 to 19 | 13 | 8,365 | 1,656 | 453 | 173 | 3,469 | 2,406 | 1,843 |
| Construction | 20 or more | 10 | 23,428 | 4,684 | 1,245 | 521 | 7,140 | 6,651 | 4,608 |
| Manufacturing | No paid | 0 | 0 | 0 | 0 | 0 | 0 | 0 | 0 |
| Manufacturing | 1 to 4 | 17 | 1,430 | 487 | 133 | 37 | 1,433 | 321 | 323 |
| Manufacturing | 5 to 9 | 8 | 1,507 | 496 | 121 | 50 | 1,188 | 146 | 140 |
| Manufacturing | 10 to 19 | 6 | 2,370 | 907 | 244 | 82 | 1,641 | 744 | 844 |
| Manufacturing | 20 or more | 8 | 15,580 | 4,810 | 1,240 | 423 | 11,285 | 1,877 | 2,822 |
| Wholesale trade | No paid | 0 | 0 | 0 | 0 | 0 | 0 | 0 | 0 |
| Wholesale trade | 1 to 4 | 29 | 11,986 | 893 | 246 | 61 | 2,564 | 1,610 | 2,183 |
| Wholesale trade | 5 to 9 | 17 | 32,468 | 1,832 | 452 | 124 | 7,884 | 8,427 | 8,115 |
| Wholesale trade | 10 to 19 | 20 | 67,621 | 3,998 | 1,016 | 281 | 12,206 | 10,786 | 10,024 |
| Wholesale trade | 20 or more | 8 | 134,752 | 4,024 | 972 | 251 | 20,333 | 16,749 | 23,362 |
| Retail trade | No paid | 3 | 188 | 29 | 0 | 0 | 48 | S | 217 |
| Retail trade | 1 to 4 | 135 | 27,218 | 3,611 | 833 | 325 | 9,331 | 10,115 | 10,981 |
| Retail trade | 5 to 9 | 77 | 57,537 | 6,365 | 1,648 | 520 | 16,911 | 19,703 | 22,506 |
| Retail trade | 10 to 19 | 38 | 52,311 | 6,458 | 1,540 | 527 | 15,788 | 13,111 | 14,318 |
| Retail trade | 20 or more | 31 | 176,812 | 14,199 | 3,980 | 1,091 | 43,217 | 36,008 | 43,692 |
| Transportation and warehousing | No paid | 0 | 0 | 0 | 0 | 0 | 0 | 0 | 0 |
| Transportation and warehousing | 1 to 4 | 10 | 793 | 248 | 63 | 22 | 653 | S | S |
| Transportation and warehousing | 5 to 9 | 1 | D | D | D | a | D | D | D |
| Transportation and warehousing | 10 to 19 | 5 | 10,740 | 1,124 | 267 | 72 | 2,175 | 0 | 0 |
| Transportation and warehousing | 20 or more | 10 | 34,466 | 9,876 | 2,486 | 542 | 22,023 | 78 | 94 |
| Information | No paid | 0 | 0 | 0 | 0 | 0 | 0 | 0 | 0 |
| Information | 1 to 4 | 9 | 464 | 199 | 58 | 13 | 329 | 0 | S |
| Information | 5 to 9 | 6 | 2,308 | 756 | 173 | 42 | 1,299 | 165 | 143 |
| Information | 10 to 19 | 2 | D | D | D | b | D | D | D |
| Information | 20 or more | 3 | 21,522 | 6,879 | 1,716 | 239 | 15,104 | 911 | 856 |
| Finance and insurance | No paid | 0 | 0 | 0 | 0 | 0 | 0 | X | X |
| Finance and insurance | 1 to 4 | 22 | 3,769 | 1,071 | 274 | 53 | 3,880 | X | X |
| Finance and insurance | 5 to 9 | 15 | 7,672 | 2,043 | 511 | 101 | 5,428 | X | X |
| Finance and insurance | 10 to 19 | 9 | 43,737 | 3,927 | 1,069 | 129 | 10,286 | X | X |
| Finance and insurance | 20 or more | 1 | D | D | D | b | D | X | X |
| Real estate and rental and leasing | No paid | 0 | 0 | 0 | 0 | 0 | 0 | X | X |
| Real estate and rental and leasing | 1 to 4 | 133 | 12,138 | 2,671 | 627 | 251 | 10,147 | X | X |
| Real estate and rental and leasing | 5 to 9 | 27 | 6,216 | 1,907 | 483 | 174 | 5,288 | X | X |
| Real estate and rental and leasing | 10 to 19 | 13 | 8,277 | 2,353 | 587 | 169 | 7,034 | X | X |
| Real estate and rental and leasing | 20 or more | 4 | 4,045 | 1,374 | 235 | 101 | 3,931 | X | X |
| Professional, scientific, and technical services | No paid | 1 | D | D | D | a | D | X | X |
| Professional, scientific, and technical services | 1 to 4 | 66 | 10,424 | 2,564 | 651 | 136 | 5,527 | X | X |
| Professional, scientific, and technical services | 5 to 9 | 25 | 6,741 | 3,294 | 707 | 152 | 6,387 | X | X |
| Professional, scientific, and technical services | 10 to 19 | 11 | 9,394 | 2,819 | 696 | 136 | 5,720 | X | X |
| Professional, scientific, and technical services | 20 or more | 2 | D | D | D | c | D | X | X |
| Administrative and support and waste management and remediation services | No paid | 2 | D | D | D | a | D | X | X |
| Administrative and support and waste management and remediation services | 1 to 4 | 47 | 4,343 | 1,300 | 309 | 113 | 3,208 | X | X |
| Administrative and support and waste management and remediation services | 5 to 9 | 33 | 11,665 | 2,454 | 656 | 213 | 5,477 | X | X |
| Administrative and support and waste management and remediation services | 10 to 19 | 15 | 7,639 | 2,788 | 681 | 179 | 5,727 | X | X |
| Administrative and support and waste management and remediation services | 20 or more | 18 | 27,050 | 11,101 | 2,746 | 891 | 19,811 | X | X |
| Educational services | No paid | 0 | 0 | 0 | 0 | 0 | 0 | X | X |
| Educational services | 1 to 4 | 39 | 4,011 | 996 | 254 | 95 | 3,231 | X | X |
| Educational services | 5 to 9 | 2 | D | D | D | a | D | X | X |
| Educational services | 10 to 19 | 2 | D | D | D | b | D | X | X |
| Educational services | 20 or more | 0 | 0 | 0 | 0 | 0 | 0 | X | X |
| Health care and social assistance | No paid | 0 | 0 | 0 | 0 | 0 | 0 | X | X |
| Health care and social assistance | 1 to 4 | 11 | 877 | 494 | 124 | 26 | 928 | X | X |
| Health care and social assistance | 5 to 9 | 6 | 1,251 | 688 | 149 | 38 | 1,092 | X | X |
| Health care and social assistance | 10 to 19 | 9 | 2,552 | 1,302 | 283 | 112 | 2,259 | X | X |
| Health care and social assistance | 20 or more | 10 | 36,668 | 17,172 | 3,576 | 549 | 33,772 | X | X |
| Arts, entertainment, and recreation | No paid | 1 | D | D | D | a | D | X | X |
| Arts, entertainment, and recreation | 1 to 4 | 9 | 466 | 127 | 42 | 17 | 326 | X | X |
| Arts, entertainment, and recreation | 5 to 9 | 15 | 7,200 | 1,308 | 257 | 95 | 4,433 | X | X |
| Arts, entertainment, and recreation | 10 to 19 | 14 | 18,972 | 3,055 | 737 | 178 | 12,751 | X | X |
| Arts, entertainment, and recreation | 20 or more | 4 | 10,619 | 2,624 | 762 | 204 | 11,028 | X | X |
| Accommodation and food services | No paid | 3 | 145 | 41 | 0 | 0 | 154 | X | X |
| Accommodation and food services | 1 to 4 | 44 | 4,066 | 1,011 | 273 | 118 | 2,170 | X | X |
| Accommodation and food services | 5 to 9 | 37 | 6,259 | 1,815 | 467 | 248 | 4,802 | X | X |
| Accommodation and food services | 10 to 19 | 31 | 16,034 | 3,795 | 923 | 422 | 8,613 | X | X |
| Accommodation and food services | 20 or more | 27 | 153,471 | 31,099 | 8,137 | 2,406 | 107,167 | X | X |
| Other services (except public administration) | No paid | 4 | D | D | D | a | D | X | X |
| Other services (except public administration) | 1 to 4 | 70 | 7,919 | 1,975 | 463 | 151 | 6,188 | X | X |
| Other services (except public administration) | 5 to 9 | 23 | 5,709 | 2,225 | 480 | 158 | 4,558 | X | X |
| Other services (except public administration) | 10 to 19 | 15 | 4,654 | 1,582 | 409 | 188 | 3,287 | X | X |
| Other services (except public administration) | 20 or more | 3 | 2,178 | 693 | 171 | 78 | 1,943 | X | X |
Ch.11 TRADE
To download, right click the chart and select “Save Image As”…