DescriptionTable DataChart and Figure Data
Ch.13 GOVERNMENT ACCOUNTS
Ch.13 GOVERNMENT ACCOUNTS
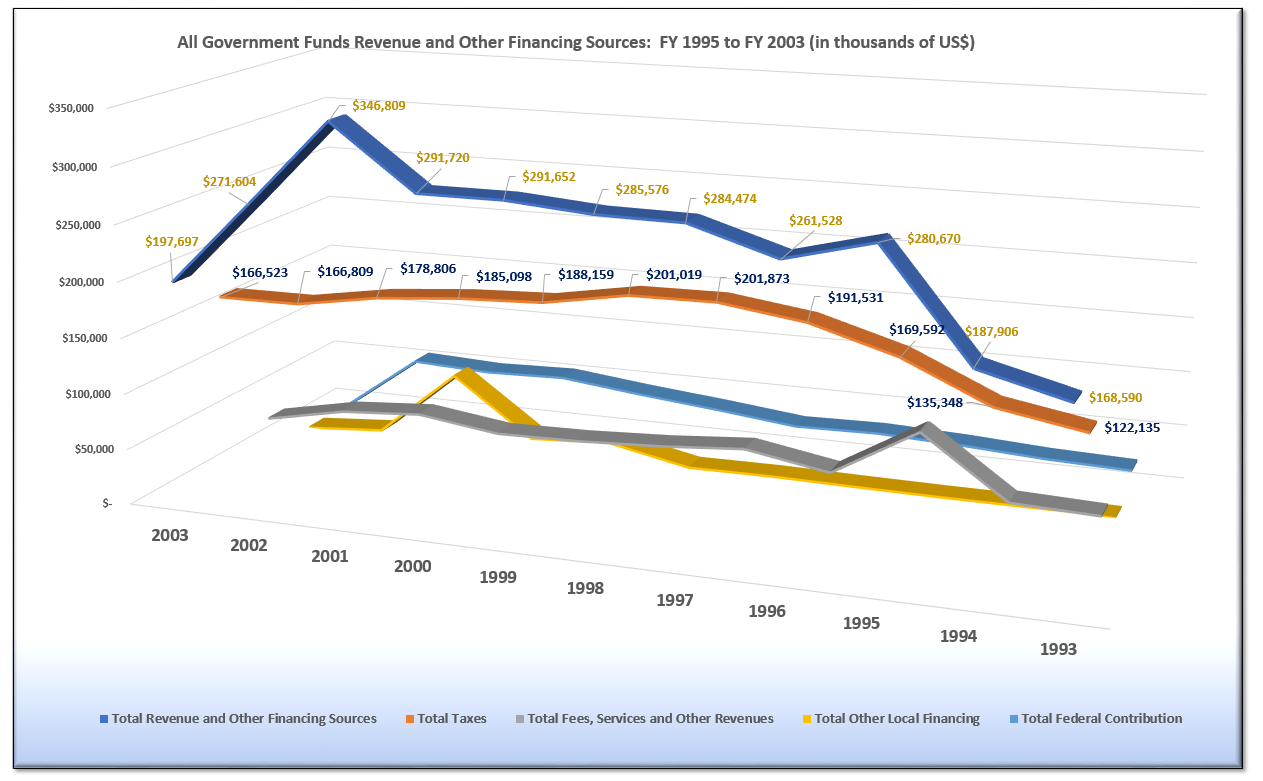
SY 2017 Table 13.1 All Government Funds Revenue and Other Financing Sources: FY 1993 to 2003
Statistical Yearbook 2017 CNMI CSD
Note: The amounts in thousands of US$
Note: FY 2002 and FY 2003 Unaudited Finance Data
Note: “…” means data not submitted
| Revenues | 2003 | 2002 | 2001 | 2000 | 1999 | 1998 | 1997 | 1996 | 1995 | 1994 | 1993 | |
|---|---|---|---|---|---|---|---|---|---|---|---|---|
| Source: Department of Finance | ||||||||||||
| Taxes | General Fund Tax Revenue | $166,523 | $166,750 | $178,527 | $184,996 | $187,884 | $199,984 | $200,879 | $190,941 | $168,891 | $134,922 | $122,135 |
| Taxes | Developer’s Tax | $59 | $279 | $102 | $275 | $1,035 | $994 | $590 | $701 | $426 | $- | |
| Fees, Services and Other Revenues | General Fund Fees, Services & Other Rev | $31,174 | $28,696 | $35,098 | $30,829 | $33,251 | $36,959 | $41,682 | $31,414 | $30,888 | $17,277 | $15,979 |
| Fees, Services and Other Revenues | Non Resident Worker/Deportation Fees | … | $6,256 | $6,707 | $6,545 | $6,149 | $7,188 | $8,126 | $6,138 | $51,115 | $2,392 | $- |
| Fees, Services and Other Revenues | Court Fines & Fees | … | $1,307 | $1,424 | $1,426 | $1,287 | $1,149 | $1,180 | $785 | $789 | $858 | $- |
| Fees, Services and Other Revenues | Mayoral Local Poker, Gaming & Other Fees | … | $4,652 | $2,390 | $2,095 | $1,137 | $- | $- | $- | $- | $- | $- |
| Fees, Services and Other Revenues | Other Fees, Services & Other Revenues | … | $535 | $819 | $248 | $617 | $733 | $950 | $645 | $900 | $541 | $8,417 |
| Fees, Services and Other Revenues | MPLC/OPL/MPLA Revenues | … | $4,500 | $4,759 | $- | $- | $- | $- | $- | $- | $8,857 | $2,825 |
| Other Local Financing | Operating Transfers In-CDA CIP Matching | … | $1,835 | $2,843 | $4,103 | $1,322 | $915 | $1,301 | $- | $- | $- | $- |
| Other Local Financing | Bank of Guam Loan Proceeds | … | $- | $- | $8,175 | $14,980 | $- | $- | $- | $- | $- | $- |
| Other Local Financing | PSS Bond Proceeds (CIP) | … | $- | $- | $- | $- | $- | $- | $- | $- | $- | $- |
| Other Local Financing | CDA $60 Million Bond Proceeds (CIP) | … | $- | $60,000 | $- | $- | $- | $- | $- | $- | $- | $- |
| Other Local Financing | Operating Transfers In-MPLT (G/F & AMP) | … | $1,507 | $1,398 | $1,322 | $1,402 | $1,585 | $1,663 | $1,937 | $1,220 | $1,058 | $- |
| Other Local Financing | Interest on Unspent Bond Proceeds | … | $2,100 | $2,638 | $- | $- | $- | $- | $- | $- | $- | $- |
| Federal Contribution | Federal Contributions – CIP | … | $27,457 | $22,836 | $21,852 | $20,327 | $15,268 | $10,682 | $11,852 | $9,216 | $6,025 | $- |
| Federal Contribution | Federal Contributions – NMHC | … | $- | $- | $224 | $1,531 | $699 | $873 | $1,328 | $579 | $772 | $- |
| Federal Contribution | Federal Contributions – Categorical Grants | … | $25,076 | $26,937 | $28,461 | $20,895 | $18,418 | $15,042 | $15,298 | $15,539 | $14,065 | $18,807 |
| Federal Contribution | Other Contributions – CIP | … | $580 | $7 | $889 | $222 | $1,269 | $701 | $316 | $675 | $686 | $- |
| Federal Contribution | Other Contributions – Other Projects | … | $294 | $147 | $453 | $373 | $374 | $401 | $284 | $157 | $27 | $427 |
Ch.13 GOVERNMENT ACCOUNTS
To download, right click the chart and select “Save Image As”…