DescriptionTable DataChart and Figure Data
Ch.13 GOVERNMENT ACCOUNTS
Ch.13 GOVERNMENT ACCOUNTS
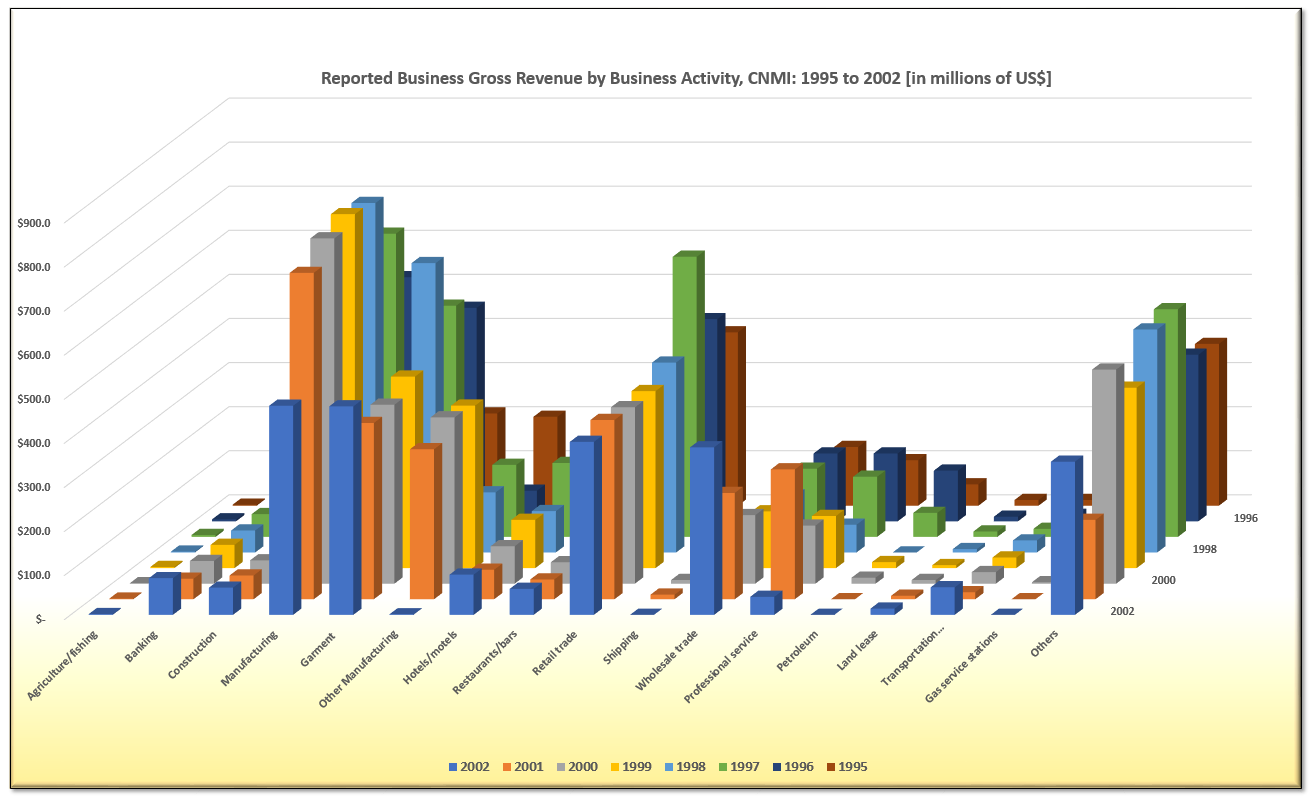
SY 2017 Table 13.6 Reported Business Gross Revenue by Business Activity, CNMI: 1995 to 2002
Statistical Yearbook 2017 CNMI CSD
Note: The amounts in millions of US$
Note: Industry category is dependent on what taxpayer reports on tax return
Note: CY 2002 Unaudited Finance Data
Note: “?” means included in Others category
| Business Activity | 2002 | 2001 | 2000 | 1999 | 1998 | 1997 | 1996 | 1995 |
|---|---|---|---|---|---|---|---|---|
| Source: Department of Finance | ||||||||
| Agriculture/fishing | $1.7 | $1.5 | $1.2 | $2.6 | $2.1 | $4.4 | $4.4 | $2.3 |
| Banking | $83.2 | $46.6 | $51.6 | $52.7 | $49.9 | $51.7 | $49.6 | $27.7 |
| Construction | $61.7 | $53.9 | $53.0 | $53.7 | $71.9 | $76.9 | $84.6 | $103.3 |
| Garment | $473.0 | $400.0 | $406.0 | $434.3 | $656.4 | $524.4 | $484.3 | $209.3 |
| Other Manufacturing | $1.3 | $340.3 | $377.3 | $368.5 | $136.4 | $163.4 | $69.4 | $201.7 |
| Hotels/motels | $91.2 | $66.9 | $85.0 | $109.4 | $93.8 | $167.6 | $170.8 | $136.2 |
| Restaurants/bars | $58.9 | $44.9 | $48.7 | $50.3 | $47.6 | $65.4 | $60.2 | $51.4 |
| Retail trade | $392.4 | $406.7 | $400.2 | $401.5 | $430.8 | $635.4 | $458.5 | $393.3 |
| Shipping | $10.5 | $8.4 | $7.5 | $5.0 | $5.1 | $4.2 | $7.9 | |
| Wholesale trade | $380.1 | $241.2 | $155.6 | $128.7 | $129.6 | $154.6 | $153.8 | $133.3 |
| Professional service | $41.0 | $294.6 | $131.7 | $118.2 | $63.0 | $136.5 | $153.9 | $103.2 |
| Petroleum | $- | $- | $13.5 | $13.6 | $- | $54.4 | $114.9 | $48.5 |
| Land lease | $14.2 | $8.0 | $8.3 | $6.7 | $7.7 | $12.2 | $10.3 | $13.0 |
| Transportation services | $62.6 | $16.0 | $26.3 | $24.0 | $27.4 | $18.3 | $14.7 | $13.0 |
| Gas service stations | $- | $3.2 | $- | $2.2 | $4.8 | $5.5 | $6.9 | |
| Others | $347.4 | $180.1 | $485.6 | $409.2 | $505.9 | $516.4 | $377.9 | $367.0 |
Ch.13 GOVERNMENT ACCOUNTS
To download, right click the chart and select “Save Image As”…