DescriptionTable DataChart and Figure Data
Ch.16 INSULAR AREAS
Ch.16 INSULAR AREAS
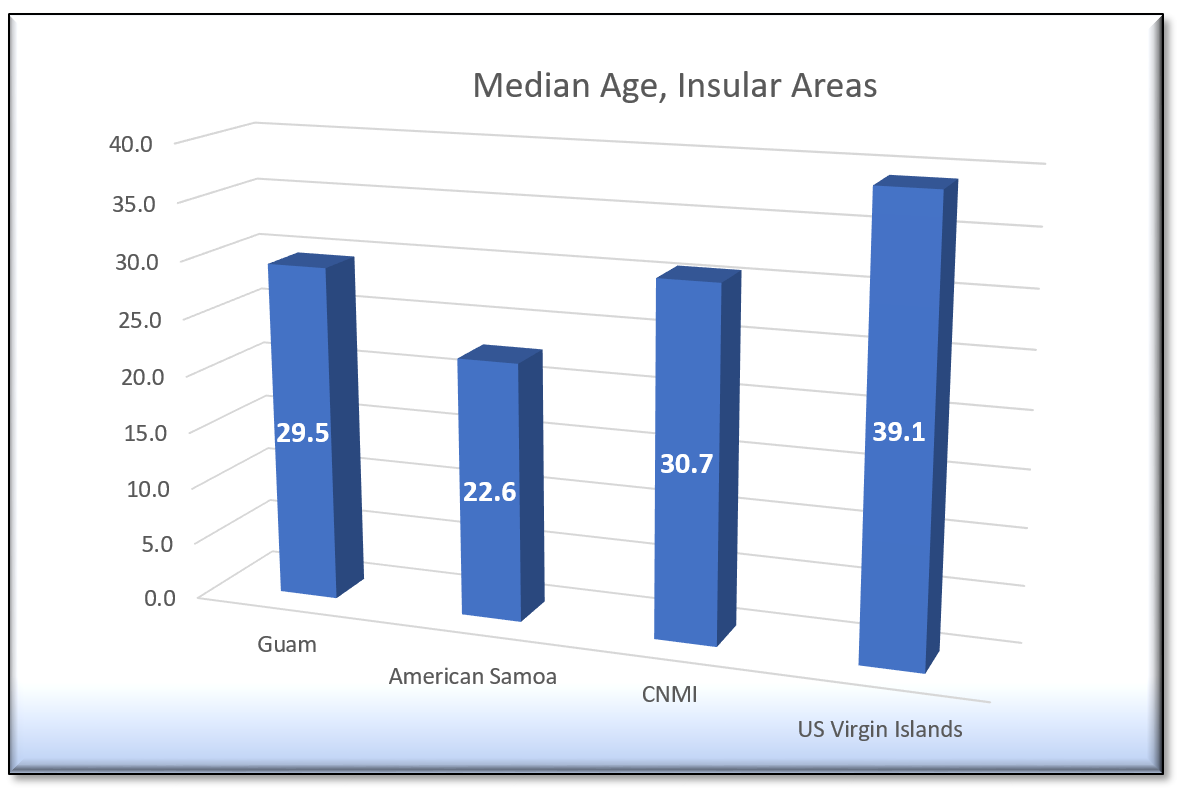
SY 2017 Table 16.1 Insular Areas by Age: 2010
Statistical Yearbook 2017 CNMI CSD
Universe: Total population
| Demographic Profile Subject | Guam | Guam | American Samoa |
American Samoa |
CNMI | CNMI | US Virgin Islands |
US Virgin Islands |
|---|---|---|---|---|---|---|---|---|
| Source: U.S. Census Bureau | ||||||||
| Under 5 years | 14,289 | 9.0% | 6,611 | 11.9% | 4,827 | 9.0% | 7,500 | 7.0% |
| 5 to 9 years | 13,984 | 8.8% | 6,535 | 11.8% | 4,613 | 8.6% | 7,150 | 6.7% |
| 10 to 14 years | 15,046 | 9.4% | 6,279 | 11.3% | 4,921 | 9.1% | 7,484 | 7.0% |
| 15 to 19 years | 14,407 | 9.0% | 6,297 | 11.3% | 4,250 | 7.9% | 7,563 | 7.1% |
| 20 to 24 years | 12,379 | 7.8% | 3,890 | 7.0% | 2,670 | 5.0% | 5,895 | 5.5% |
| 25 to 29 years | 10,746 | 6.7% | 3,325 | 6.0% | 3,027 | 5.6% | 5,974 | 5.6% |
| 30 to 34 years | 10,346 | 6.5% | 3,506 | 6.3% | 3,898 | 7.2% | 6,143 | 5.8% |
| 35 to 39 years | 11,404 | 7.2% | 3,604 | 6.5% | 5,057 | 9.4% | 6,670 | 6.3% |
| 40 to 44 years | 11,659 | 7.3% | 3,602 | 6.5% | 5,766 | 10.7% | 7,451 | 7.0% |
| 45 to 49 years | 11,072 | 6.9% | 3,387 | 6.1% | 5,009 | 9.3% | 7,730 | 7.3% |
| 50 to 54 years | 9,203 | 5.8% | 2,678 | 4.8% | 4,123 | 7.7% | 7,898 | 7.4% |
| 55 to 59 years | 7,715 | 4.8% | 2,057 | 3.7% | 2,612 | 4.8% | 7,188 | 6.8% |
| 60 to 64 years | 6,361 | 4.0% | 1,481 | 2.7% | 1,544 | 2.9% | 7,371 | 6.9% |
| 65 to 69 years | 3,889 | 2.4% | 957 | 1.7% | 699 | 1.3% | 5,854 | 5.5% |
| 70 to 74 years | 3,030 | 1.9% | 653 | 1.2% | 440 | 0.8% | 3,717 | 3.5% |
| 75 to 79 years | 1,984 | 1.2% | 340 | 0.6% | 250 | 0.5% | 2,326 | 2.2% |
| 80 to 84 years | 1,151 | 0.7% | 207 | 0.4% | 120 | 0.2% | 1,332 | 1.3% |
| 85 years and over | 693 | 0.4% | 110 | 0.2% | 57 | 0.1% | 1,159 | 1.1% |
Ch.16 INSULAR AREAS
To download, right click the chart and select “Save Image As”…