DescriptionTable DataChart and Figure Data
Ch.16 INSULAR AREAS
Ch.16 INSULAR AREAS
SY 2017 Table 16.5 Insular Areas Marital Status: 2010 (MALE)
Statistical Yearbook 2017 CNMI CSD
Universe: Population 15 years and over
| Male Marital Status | Guam | Guam | American Samoa |
American Samoa |
CNMI | CNMI | US Virgin Islands |
US Virgin Islands |
|---|---|---|---|---|---|---|---|---|
| Source: U.S. Census Bureau | ||||||||
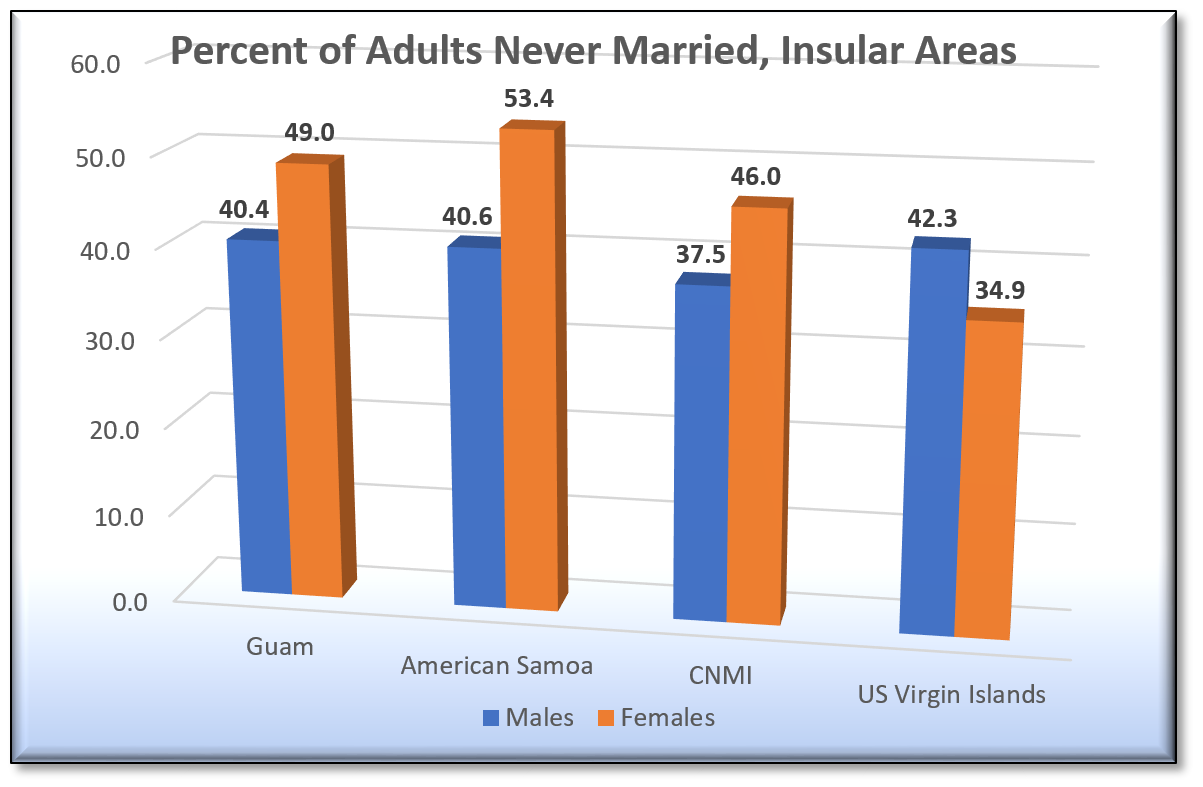
| Never married | 23,958 | 40.4% | 7,327 | 40.6% | 7,622 | 37.5% | 16,751 | 42.3% |
| Now married (except separated) | 30,025 | 50.7% | 9,854 | 54.5% | 10,766 | 52.9% | 16,156 | 40.8% |
| Separated | 831 | 1.4% | 211 | 1.2% | 865 | 4.3% | 1,037 | 2.6% |
| Widowed | 1,030 | 1.7% | 369 | 2.0% | 395 | 1.9% | 1,064 | 2.7% |
| Divorced | 3,402 | 5.7% | 308 | 1.7% | 694 | 3.4% | 4,580 | 11.6% |
SY 2017 Table 16.5 Insular Areas Marital Status: 2010 (FEMALE)
Statistical Yearbook 2017 CNMI CSD
Universe: Population 15 years and over
| Female Marital Status | Guam | Guam | American Samoa |
American Samoa |
CNMI | CNMI | US Virgin Islands |
US Virgin Islands |
|---|---|---|---|---|---|---|---|---|
| Source: U.S. Census Bureau | ||||||||
| Never married | 19,837 | 34.9% | 6,207 | 34.4% | 7,616 | 39.7% | 18,208 | 40.7% |
| Now married (except separated) | 27,831 | 49.0% | 9,631 | 53.4% | 8,819 | 46.0% | 15,602 | 34.9% |
| Separated | 945 | 1.7% | 267 | 1.5% | 720 | 3.8% | 1,328 | 3.0% |
| Widowed | 4,273 | 7.5% | 1,479 | 8.2% | 1,158 | 6.0% | 3,476 | 7.8% |
| Divorced | 3,907 | 6.9% | 441 | 2.4% | 867 | 4.5% | 6,069 | 13.6% |
Ch.16 INSULAR AREAS
To download, right click the chart and select “Save Image As”…