DescriptionTable DataChart and Figure Data
Ch.16 INSULAR AREAS
Ch.16 INSULAR AREAS
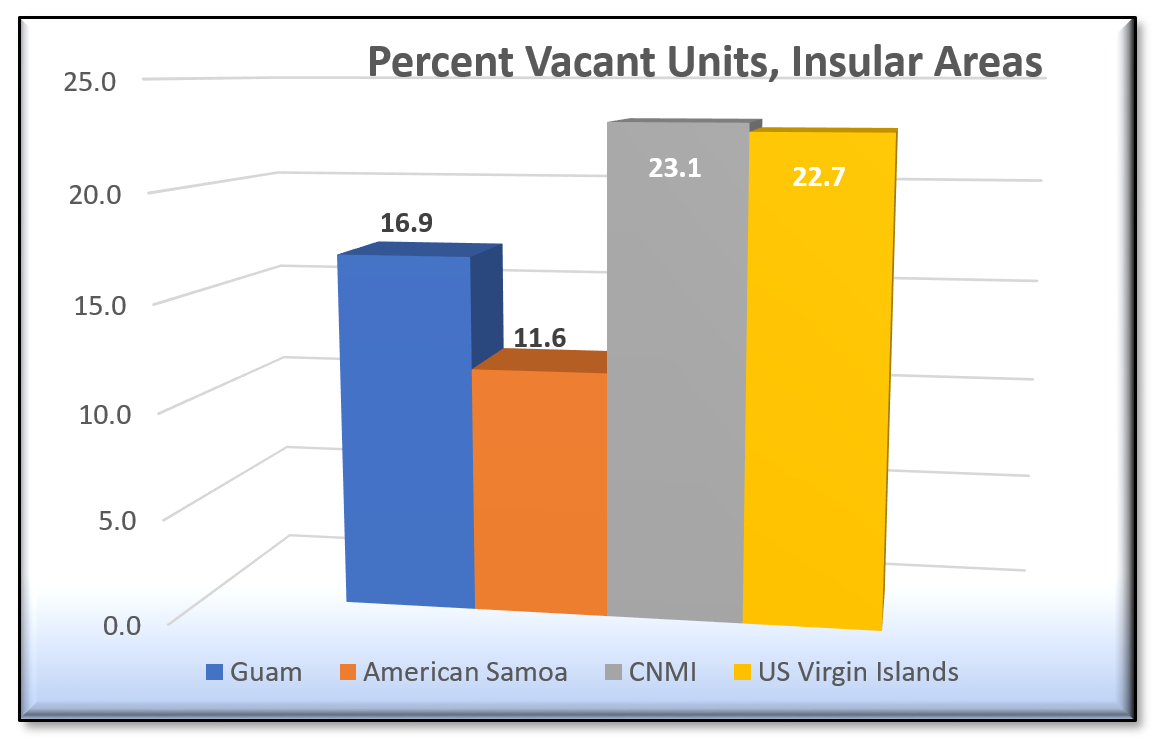
SY 2017 Table 16.8 Housing Occupancy, Insular Areas: 2010
Statistical Yearbook 2017 CNMI CSD
Universe: Total housing units
| Guam | American Samoa | CNMI | US Virgin Islands | |
|---|---|---|---|---|
| Source: U.S. Census Bureau | ||||
| Occupied housing units | 42,026 | 9,688 | 16,035 | 43,214 |
| Percent | 83.1% | 88.4% | 76.9% | 77.3% |
| Vacant units | 8,541 | 1,275 | 4,815 | 12,687 |
| (For seasonal, recreational, or occasional use) | 411 | 210 | 387 | 3,748 |
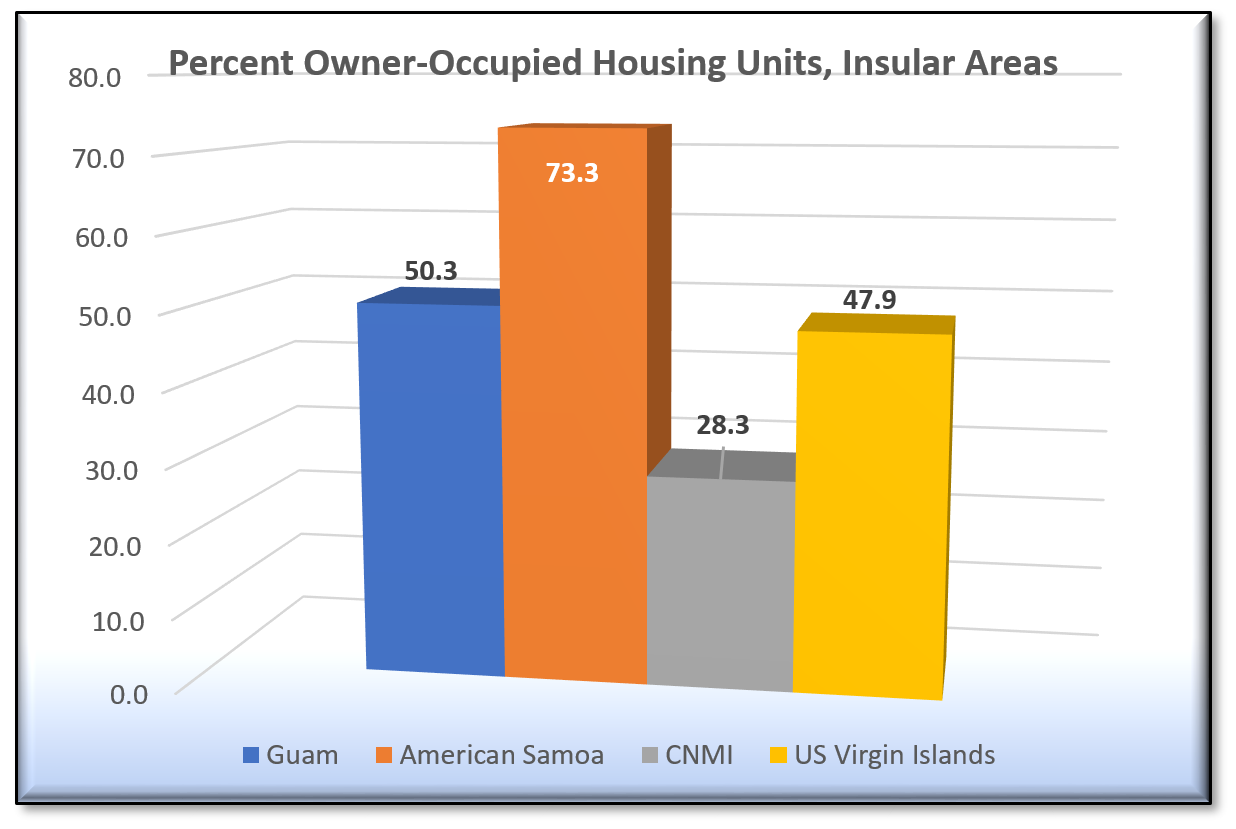
SY 2017 Table 16.9 Houing Tenure, Insular Areas: 2010
Statistical Yearbook 2017 CNMI CSD
Universe: Occupied housing units
| Guam | American Samoa | CNMI | US Virgin Islands | |
|---|---|---|---|---|
| Source: U.S. Census Bureau | ||||
| Owner-occupied housing units | 21,140 | 7,106 | 4,537 | 20,700 |
| Percent | 50.3% | 73.3% | 28.3% | 47.9% |
| Renter-occupied housing units | 20,886 | 2,582 | 11,498 | 22,514 |
Ch.16 INSULAR AREAS
To download, right click the chart and select “Save Image As”…