DescriptionTable DataChart and Figure Data
Ch.2 HEALTH
Ch.2 HEALTH
SY 2017 Table 2.19 Age by Attendant and Parity, CNMI: 2016
Statistical Yearbook 2017 CNMI CSD
| Age Group | Single: Doctor | Twin: Doctor | Single: Other medical personnel | Twin: Other medical personnel |
|---|---|---|---|---|
| Source: CNMI CHC Vital Statistics | ||||
| 15 – 19 | 25 | 0 | 34 | 0 |
| 20 – 24 | 154 | 2 | 85 | 0 |
| 25 – 29 | 256 | 1 | 71 | 0 |
| 30 – 34 | 237 | 7 | 63 | 0 |
| 35 – 39 | 149 | 8 | 64 | 0 |
| 40 – 44 | 33 | 0 | 17 | 0 |
| 45 – 49 | 9 | 2 | 0 | 0 |
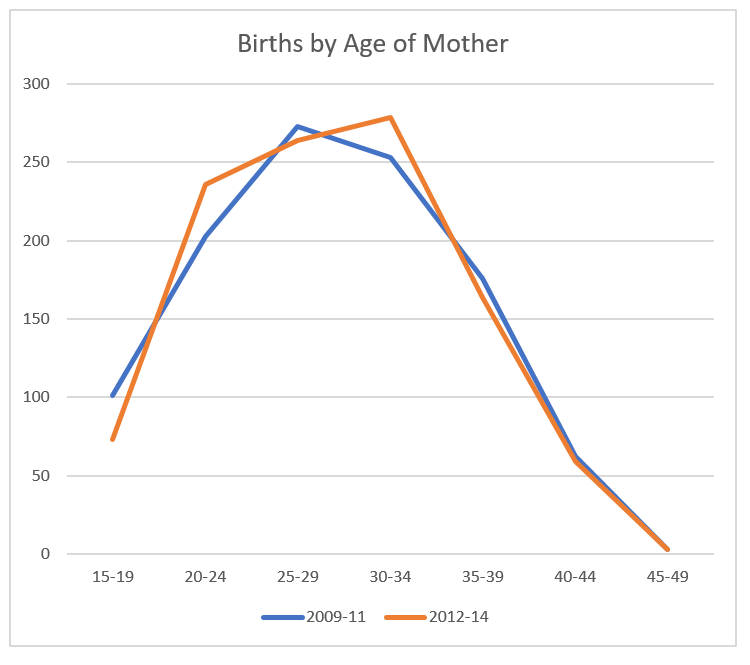
SY 2017 Table 2.20 Age-Specific Births by Residency/Visa Classification of Mother, CNMI: 2009-2014
Statistical Yearbook 2017 CNMI CSD
Note: Please see footnotes of Table 2.1 above for definitions of mothers residency/visa classification.
| Age group | Resident 2009-11 | Resident 2012-14 | Temporary resident 2009-11 | Temporary resident 2012-14 | Tourist 2009-11 | Tourist 2012-14 |
|---|---|---|---|---|---|---|
| Source: CNMI CHC Vital Statistics Note: Please see footnotes of Table 2.1 above for definitions of mothers residency/visa classification. |
||||||
| 10-14 | 2 | 2 | 0 | 0 | 0 | 0 |
| 15-19 | 98 | 70 | 2 | 0 | 1 | 3 |
| 20-24 | 166 | 193 | 24 | 10 | 13 | 33 |
| 25-29 | 157 | 124 | 82 | 39 | 34 | 101 |
| 30-34 | 108 | 106 | 102 | 70 | 43 | 103 |
| 35-39 | 61 | 57 | 92 | 55 | 23 | 52 |
| 40-44 | 16 | 15 | 41 | 30 | 5 | 15 |
| 45-49 | 0 | 0 | 3 | 2 | 0 | 0 |
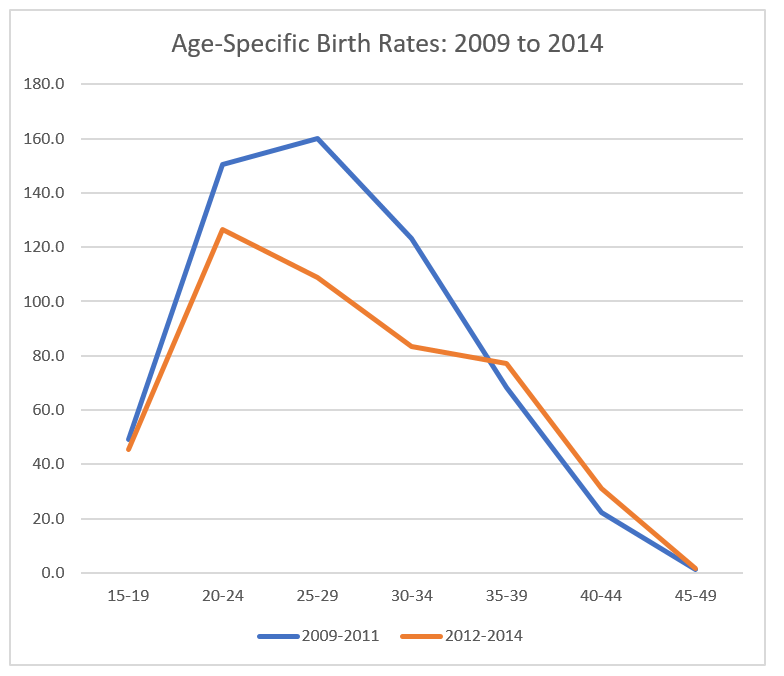
SY 2017 Table 2.21 Age-specific Fertility Rates by Residency/Visa Classification of Mother, CNMI: 2009-2011
Statistical Yearbook 2017 CNMI CSD
Note: Please see footnotes of Table 2.1 above for definitions of mothers residency/visa classification.
| Age group | Resident 2009-2011 | Temporary Resident 2009-2011 | Tourist 2009-2011 | Resident 2012-2014 | Temporary Resident 2012-2014 | Tourist 2012-2014 |
|---|---|---|---|---|---|---|
| Source: CNMI CHC Vital Statistics Note: Please see footnotes of Table 2.1 for definitions of mothers residency/visa classification. |
||||||
| 15-19 | 47.8 | 1 | 0.5 | 43.6 | 0 | 1.9 |
| 20-24 | 123.1 | 17.8 | 9.6 | 103.4 | 5.4 | 17.7 |
| 25-29 | 92 | 48.1 | 19.9 | 51.2 | 16.1 | 41.7 |
| 30-34 | 52.6 | 49.7 | 21 | 31.7 | 20.9 | 30.8 |
| 35-39 | 23.7 | 35.7 | 8.9 | 26.8 | 25.9 | 24.5 |
| 40-44 | 5.7 | 14.7 | 1.8 | 7.9 | 15.8 | 7.9 |
| 45-49 | 0 | 1.3 | 0 | 0 | 1.1 | 0 |
To download HD image, right click on image and select “Save Image As”…