DescriptionTable DataChart and Figure Data
Ch.2 HEALTH
Ch.2 HEALTH
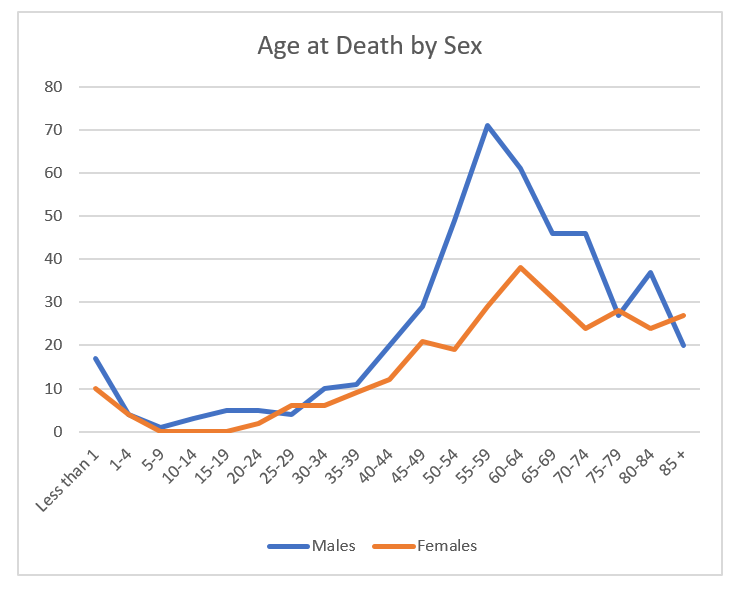
SY 2017 Table 2.29 Deaths by Age and Sex, CNMI: 2011 to 2014
Statistical Yearbook 2017 CNMI CSD
| Male: # of deaths | Female: # of deaths | Male: Average | Female: Average | |
|---|---|---|---|---|
| Source: CNMI CHC Vital Statistics | ||||
| Less than 1 | 17 | 10 | 4.25 | 2.5 |
| 1-4 | 4 | 4 | 1 | 1 |
| 5-9 | 1 | 0 | 0.25 | 0 |
| 10-14 | 3 | 0 | 0.75 | 0 |
| 15-19 | 5 | 0 | 1.25 | 0 |
| 20-24 | 5 | 2 | 1.25 | 0.5 |
| 25-29 | 4 | 6 | 1 | 1.5 |
| 30-34 | 10 | 6 | 2.5 | 1.5 |
| 35-39 | 11 | 9 | 2.75 | 2.25 |
| 40-44 | 20 | 12 | 5 | 3 |
| 45-49 | 29 | 21 | 7.25 | 5.25 |
| 50-54 | 49 | 19 | 12.25 | 4.75 |
| 55-59 | 71 | 29 | 17.75 | 7.25 |
| 60-64 | 61 | 38 | 15.25 | 9.5 |
| 65-69 | 46 | 31 | 11.5 | 7.75 |
| 70-74 | 46 | 24 | 11.5 | 6 |
| 75-79 | 27 | 28 | 6.75 | 7 |
| 80-84 | 37 | 24 | 9.25 | 6 |
| 85 + | 20 | 27 | 5 | 6.75 |
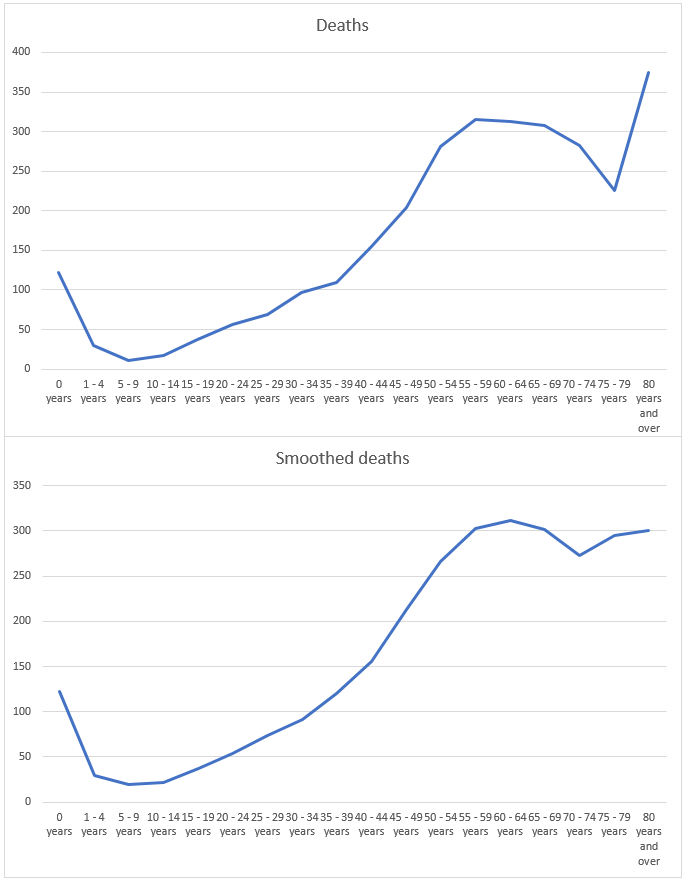
SY 2017 Table 2.30 Age at death, CNMI: 2000 to 2016
Statistical Yearbook 2017 CNMI CSD
| 2000-2004 | 2005-2009 | 2010-2011 | 2012 | 2013 | 2014 | 2015 | 2016 | |
|---|---|---|---|---|---|---|---|---|
| Source: CNMI CHC Vital Statistics | ||||||||
| 0 years | 51 | 28 | 6 | 8 | 11 | 6 | 5 | 7 |
| 1 – 4 years | 6 | 11 | 2 | 3 | 2 | 1 | 1 | 4 |
| 5 – 9 years | 4 | 1 | 3 | 0 | 0 | 0 | 3 | 0 |
| 10 – 14 years | 8 | 6 | 2 | 0 | 0 | 1 | 0 | 0 |
| 15 – 19 years | 16 | 9 | 4 | 0 | 2 | 1 | 2 | 3 |
| 20 – 24 years | 25 | 14 | 1 | 0 | 4 | 3 | 7 | 2 |
| 25 – 29 years | 25 | 20 | 6 | 3 | 3 | 0 | 5 | 7 |
| 30 – 34 years | 34 | 34 | 9 | 8 | 2 | 3 | 5 | 2 |
| 35 – 39 years | 40 | 34 | 7 | 6 | 4 | 6 | 7 | 5 |
| 40 – 44 years | 38 | 60 | 18 | 7 | 7 | 9 | 6 | 10 |
| 45 – 49 years | 55 | 55 | 25 | 11 | 12 | 12 | 17 | 17 |
| 50 – 54 years | 70 | 87 | 31 | 19 | 22 | 12 | 20 | 20 |
| 55 – 59 years | 54 | 92 | 39 | 23 | 24 | 30 | 25 | 28 |
| 60 – 64 years | 55 | 83 | 48 | 26 | 18 | 28 | 27 | 28 |
| 65 – 69 years | 64 | 95 | 33 | 12 | 23 | 25 | 26 | 30 |
| 70 – 74 years | 73 | 86 | 30 | 14 | 25 | 22 | 20 | 13 |
| 75 – 79 years | 59 | 63 | 30 | 11 | 10 | 16 | 17 | 20 |
| 80 years and over | 91 | 99 | 39 | 23 | 31 | 34 | 32 | 26 |
| Median | 56.1 | 59.3 | 61.4 | 59.8 | 61.9 | 63.7 | 61.8 | 61.1 |
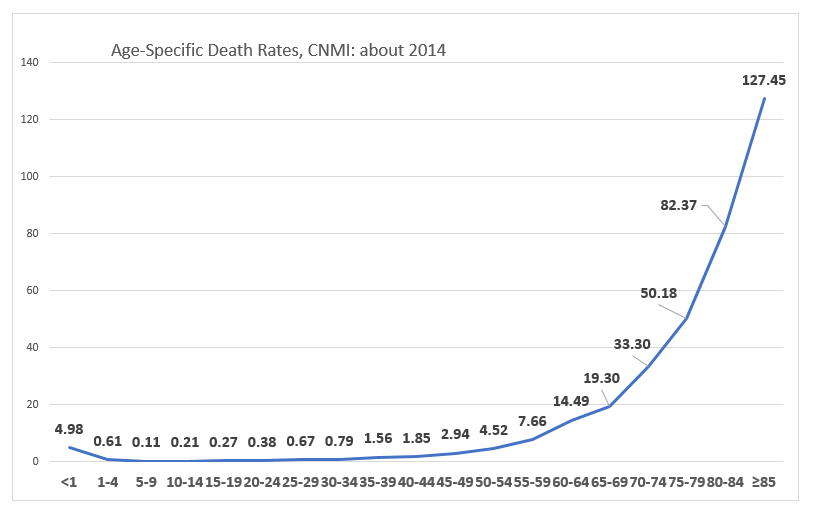
SY 2017 Table 2.31 Determination of Age-Specific Deaths Rates, CNMI: About 2014
Statistical Yearbook 2017 CNMI CSD
Note: Poisson for <100 deaths.
?100 Norm Approx Binom.
Deaths > 0 and < 1 are rounded to 1 for Poisson CIs.
Zero death rates (from zero deaths) are dropped fom the graph because of the log scale.
| Deaths | Population | Age-Specific Death Rates per 1,000 | Age-Specific Death Rates: L 95% CI | Age-Specific Death Rates: U 95% CI | |
|---|---|---|---|---|---|
| Source: Life Table and Probability of Dying Calulation Tool, UNSW, Australia Note: Poisson for <100 deaths. ≥100 Norm Approx Binom. Deaths > 0 and < 1 are rounded to 1 for Poisson CIs. Zero death rates (from zero deaths) are dropped fom the graph because of the log scale. |
|||||
| <1 | 5 | 1005 | 4.975124378 | 1.615409343 | 14.3774879 |
| 1-4 | 2.5 | 4085 | 0.611995104 | 0.101739488 | 2.288470895 |
| 5-9 | 0.5 | 4586 | 0.109027475 | 0.005520673 | 1.608756849 |
| 10-14 | 0.75 | 3627 | 0.206782465 | 0.006980372 | 2.034121563 |
| 15-19 | 1 | 3701 | 0.270197244 | 0.006840802 | 1.993450124 |
| 20-24 | 1.5 | 3903 | 0.384319754 | 0.027644797 | 1.890278993 |
| 25-29 | 2.5 | 3742 | 0.668091929 | 0.111065154 | 2.498237201 |
| 30-34 | 3.5 | 4411 | 0.793470868 | 0.191551709 | 2.526249554 |
| 35-39 | 5.5 | 3524 | 1.560726447 | 0.541394474 | 4.100276769 |
| 40-44 | 7.25 | 3925 | 1.847133758 | 0.717035172 | 4.46740029 |
| 45-49 | 11.25 | 3830 | 2.937336815 | 1.433723333 | 6.093123801 |
| 50-54 | 17.5 | 3870 | 4.521963824 | 2.6575422 | 8.146351018 |
| 55-59 | 23.25 | 3036 | 7.658102767 | 4.802380447 | 12.96576977 |
| 60-64 | 25.25 | 1743 | 14.4865175 | 9.282089414 | 24.05230642 |
| 65-69 | 20.75 | 1075 | 19.30232558 | 11.72768309 | 33.00360549 |
| 70-74 | 18.25 | 548 | 33.30291971 | 19.46704522 | 59.94950157 |
| 75-79 | 14.25 | 284 | 50.17605634 | 26.95045872 | 96.79011572 |
| 80-84 | 14.25 | 173 | 82.3699422 | 44.24237154 | 158.8924443 |
| ≥85 | 13 | 102 | 127.4509804 | 67.86227932 | 256.0681181 |
To download HD image, right click on image and select “Save Image As”…