DescriptionTable DataChart and Figure Data
Ch.22 HISTORICAL
Ch.22 HISTORICAL
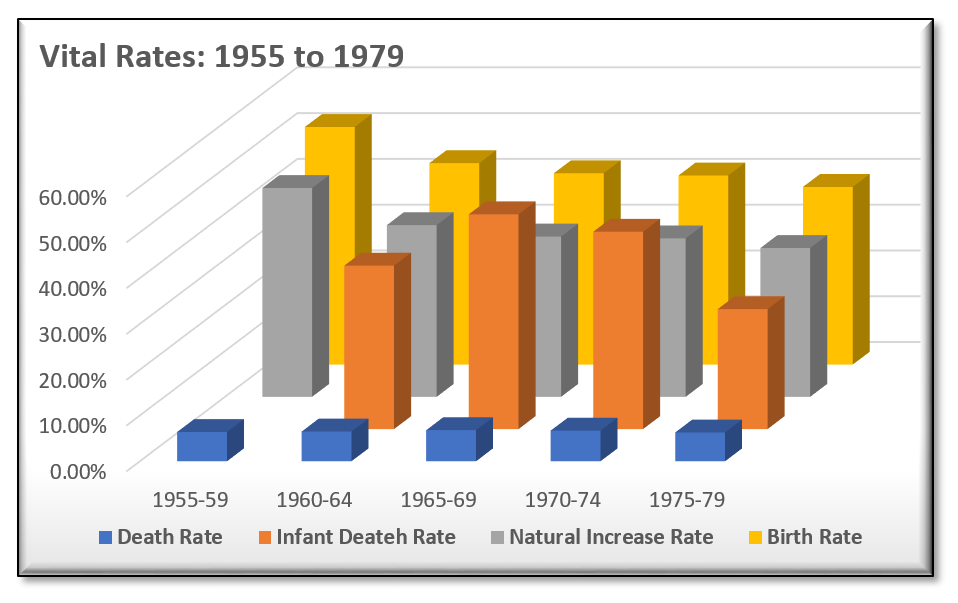
SY 2017 Table 22.17 Vital Rates: 1955 to 1979
Statistical Yearbook 2017 CNMI CSD
| Year | Estimated Population |
Births | Birth Rate |
Infant Deaths |
Infant Deateh Rate |
Deaths | Death rate |
Natural Increase |
Natural Increase Rate |
|---|---|---|---|---|---|---|---|---|---|
| Source: Population from Annual Reports; births and deaths from registration | |||||||||
| 1975-79 | 14,362 | 2,783 | 38.8% | 73 | 26.2% | 452 | 6.3% | 2,331 | 32.5% |
| 1970-74 | 12,134 | 2,508 | 41.3% | 108 | 43.1% | 409 | 6.7% | 2,099 | 34.6% |
| 1965-69 | 11,099 | 2,322 | 41.8% | 109 | 46.9% | 379 | 6.8% | 1,943 | 35.0% |
| 1960-64 | 9,671 | 2,128 | 44.0% | 76 | 35.7% | 315 | 6.5% | 1,813 | 37.5% |
| 1955-59 | 7,951 | 2,065 | 51.9% | (NA) | (NA) | 253 | 6.4% | 1,812 | 45.6% |
Ch.22 HISTORICAL
To download, right click on the chart and select “Save Image As”…