DescriptionTable DataChart and Figure Data
Ch.22 HISTORICAL
Ch.22 HISTORICAL
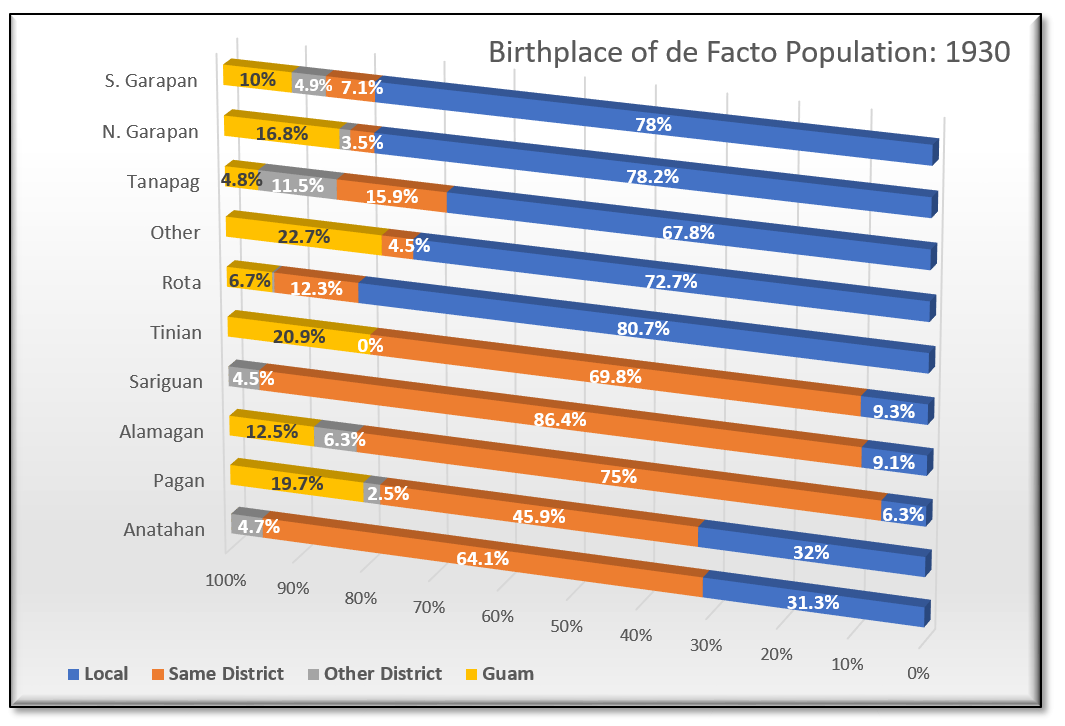
SY 2017 Table 22.6 Birthplace of de Facto Population: 1930
Statistical Yearbook 2017 CNMI CSD
| Same Locality |
Same Locality |
Same District |
Same District |
Other District |
Other District |
Guam | Guam | ||
|---|---|---|---|---|---|---|---|---|---|
| Source: 1930 Japanese Census Report, Natives Only | |||||||||
| Saipan | S. Garapan | 838 | 78.0% | 76 | 7.1% | 53 | 4.9% | 107 | 10.0% |
| Saipan | N. Garapan | 1,245 | 78.2% | 55 | 3.5% | 25 | 1.6% | 267 | 16.8% |
| Saipan | Tanapag | 154 | 67.8% | 36 | 15.9% | 26 | 11.5% | 11 | 4.8% |
| Saipan | Other | 16 | 72.7% | 1 | 4.5% | 0 | 0% | 5 | 22.7% |
| Rota | Rota | 520 | 80.7% | 79 | 12.3% | 2 | 0.3% | 43 | 6.7% |
| Tinian | Tinian | 4 | 9.3% | 30 | 69.8% | 0 | 0% | 9 | 20.9% |
| Northern Islands | Sariguan | 2 | 9.1% | 19 | 86.4% | 1 | 4.5% | 0 | 0% |
| Northern Islands | Alamagan | 1 | 6.3% | 12 | 75.0% | 1 | 6.3% | 2 | 12.5% |
| Northern Islands | Pagan | 39 | 32.0% | 56 | 45.9% | 3 | 2.5% | 24 | 19.7% |
| Northern Islands | Anatahan | 20 | 31.3% | 41 | 64.1% | 3 | 4.7% | 0 | 0% |
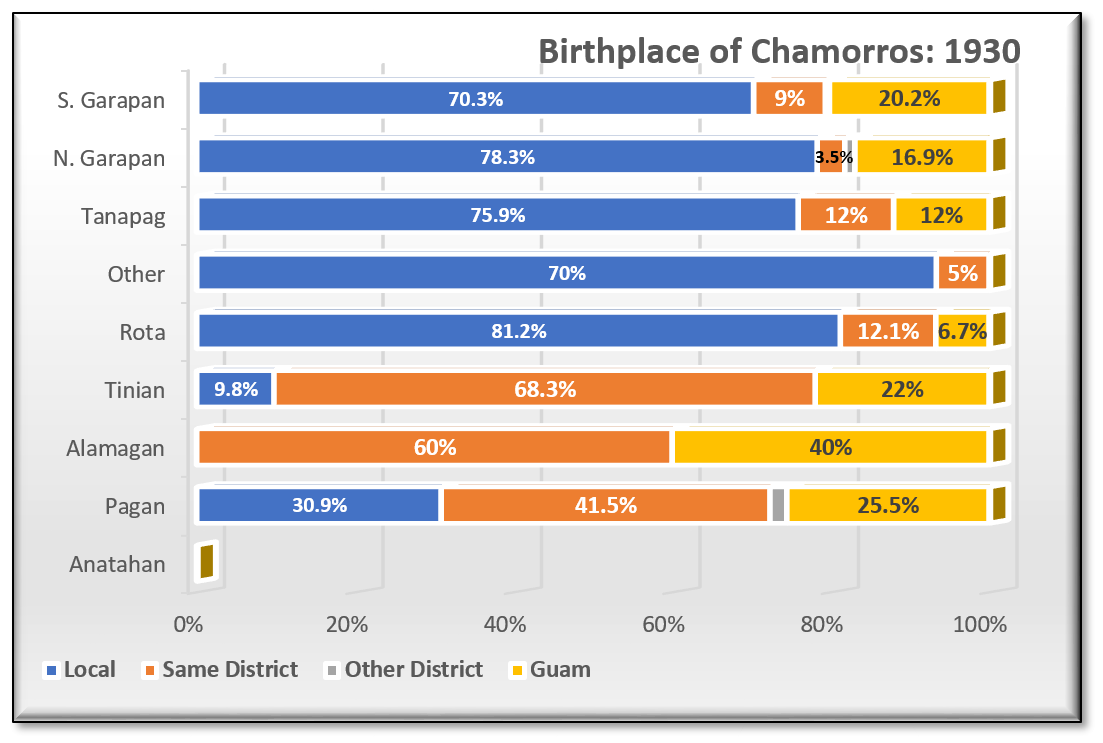
SY 2017 Table 22.7 Birthplace of Chamorros: 1930
Statistical Yearbook 2017 CNMI CSD
| Same Locality |
Same Locality |
Same District |
Same District |
Other District |
Other District |
Guam | Guam | ||
|---|---|---|---|---|---|---|---|---|---|
| Source: 1930 Japanese Census Report, Natives Only | |||||||||
| Saipan | S. Garapan | 272 | 70.3% | 35 | 9.0% | 2 | 0.5% | 78 | 20.2% |
| Saipan | N. Garapan | 1,234 | 78.3% | 55 | 3.5% | 20 | 1.3% | 267 | 16.9% |
| Saipan | Tanapag | 63 | 75.9% | 10 | 12.0% | 0 | 0% | 10 | 12.0% |
| Saipan | Other | 14 | 70.0% | 1 | 5.0% | 0 | 0% | 0 | 0% |
| Rota | Rota | 519 | 81.2% | 77 | 12.1% | 0 | 0% | 43 | 6.7% |
| Tinian | Tinian | 4 | 9.8% | 28 | 68.3% | 0 | 0% | 9 | 22.0% |
| Northern Islands | Alamagan | – | 0% | 3 | 60.0% | 0 | 0% | 2 | 40.0% |
| Northern Islands | Pagan | 29 | 30.9% | 39 | 41.5% | 2 | 2.1% | 24 | 25.5% |
| Northern Islands | Anatahan | – | 0% | 0 | 0% | 0 | 0% | 0 | 0% |
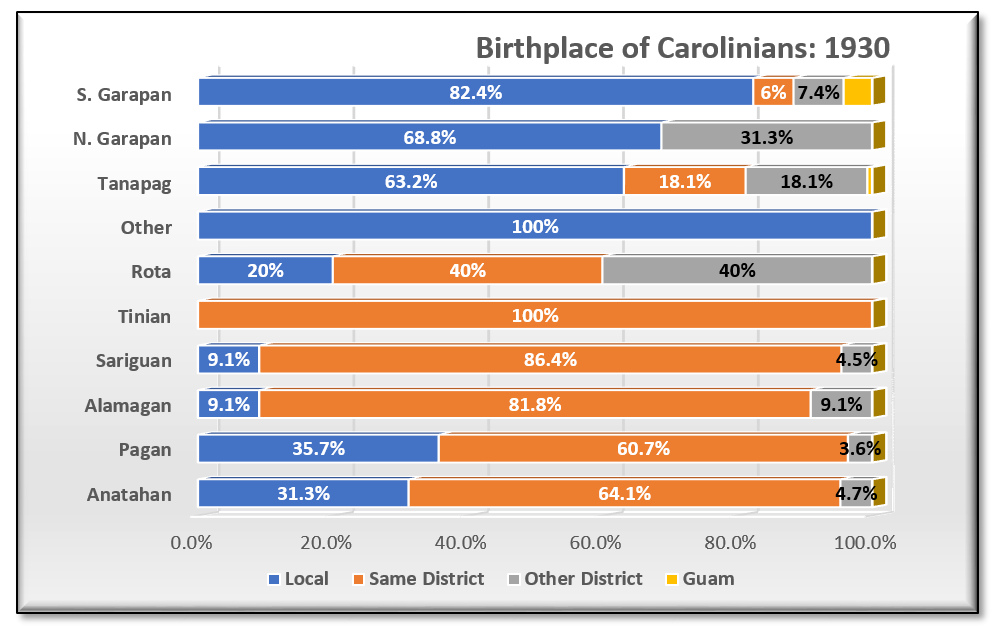
SY 2017 Table 22.8 Birthplace of Carolinians: 1930
Statistical Yearbook 2017 CNMI CSD
| Same Locality |
Same Locality |
Same District |
Same District |
Other District |
Other District |
Guam | Guam | ||
|---|---|---|---|---|---|---|---|---|---|
| Source: 1930 Japanese Census Report, Natives Only | |||||||||
| Saipan | S. Garapan | 566 | 82.4% | 41 | 6.0% | 51 | 7.4% | 29 | 4.2% |
| Saipan | N. Garapan | 11 | 68.8% | 0 | 0% | 5 | 31.3% | 0 | 0% |
| Saipan | Tanapag | 91 | 63.2% | 26 | 18.1% | 26 | 18.1% | 1 | 0.7% |
| Saipan | Other | 2 | 100% | 0 | 0% | 0 | 0% | 0 | 0% |
| Rota | Rota | 1 | 20.0% | 2 | 40.0% | 2 | 40.0% | 0 | 0% |
| Tinian | Tinian | 0 | 0% | 2 | 100% | 0 | 0% | 0 | 0% |
| Northern Islands | Sariguan | 2 | 9.1% | 19 | 86.4% | 1 | 4.5% | 0 | 0% |
| Northern Islands | Alamagan | 1 | 9.1% | 9 | 81.8% | 1 | 9.1% | 0 | 0% |
| Northern Islands | Pagan | 10 | 35.7% | 17 | 60.7% | 1 | 3.6% | 0 | 0% |
| Northern Islands | Anatahan | 20 | 31.3% | 41 | 64.1% | 3 | 4.7% | 0 | 0% |
Ch.22 HISTORICAL
To download, right click on the chart and select “Save Image As”…