DescriptionTable DataChart and Figure Data
Ch.3 EDUCATION
Ch.3 EDUCATION
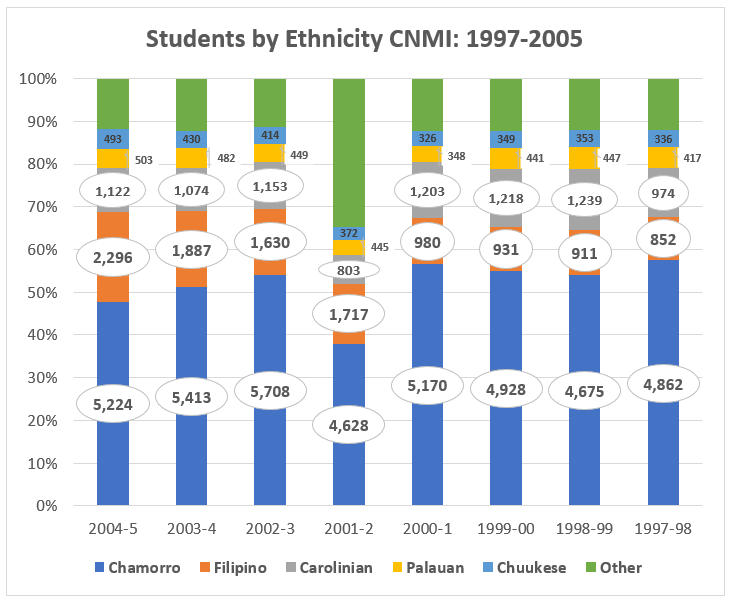
SY 2017 Table 3.10 Students by Ethnicity, CNMI: SY 1996-97 to SY 2004-05
Statistical Yearbook 2017 CNMI CSD
Note: Total in this table differ from totals in other tables. Headstart and Special Education ethnic breakdown were not included and the tabulations of total by ethnicity were performed at different times during the school year.
| 2004-05 | 2002-03 | 2001-02 | 2000-01 | 1999-00 | 1998-99 | 1997-98 | 1996-97 | |
|---|---|---|---|---|---|---|---|---|
| Source: Public School System | ||||||||
| Chamorro | 5,224 | 5,413 | 5,708 | 4,628 | 5,170 | 4,928 | 4,675 | 4,862 |
| Carolinian | 1,122 | 1,074 | 1,153 | 803 | 1,203 | 1,218 | 1,239 | 974 |
| Chamolinian | 297 | 389 | 361 | 387 | 441 | 431 | 390 | 293 |
| African/American | 2 | 3 | 4 | 168 | 67 | 76 | 86 | 73 |
| Palauan | 503 | 482 | 449 | 445 | 348 | 441 | 447 | 417 |
| Pohnpeian | 212 | 209 | 136 | 168 | 150 | 197 | 159 | 160 |
| Yapese | 75 | 68 | 55 | 53 | 57 | 58 | 53 | 74 |
| Chuukese | 493 | 430 | 414 | 372 | 326 | 349 | 353 | 336 |
| Marshallese | 47 | 47 | 50 | 55 | 47 | 42 | 35 | 37 |
| Filipino | 2,296 | 1,887 | 1,630 | 1,717 | 980 | 931 | 911 | 852 |
| Korean | 205 | 160 | 128 | 458 | 134 | 157 | 171 | 136 |
| Japanese | 36 | 22 | 12 | 86 | 9 | 10 | 3 | 2 |
| Other | 430 | 397 | 454 | 2853 | 211 | 134 | 136 | 249 |
To download HD image, right click on image and select “Save Image As”…