DescriptionTable DataChart and Figure Data
Ch.4 LABOR
Ch.4 LABOR
SY 2017 Table 4.1 CNMI Employment Status by Sex, CNMI: 1973 to 2010
Statistical Yearbook 2017 CNMI CSD
Note: “?” means data not available
Universe: Persons 16 years and over
| Employment Status | 2010 | 2000 | 1995 | 1990 | 1980 | 1973 |
|---|---|---|---|---|---|---|
| Source: Recent Trends in Population, Current Labor Force Survey and Census 2000 Population and Housing Profiles | ||||||
| Persons 16 years and over | 38,679 | 52,898 | 43,846 | 32,522 | 9,599 | 7,601 |
| In labor force | 27,968 | 44,471 | 37,540 | 26,581 | 6,089 | 4,787 |
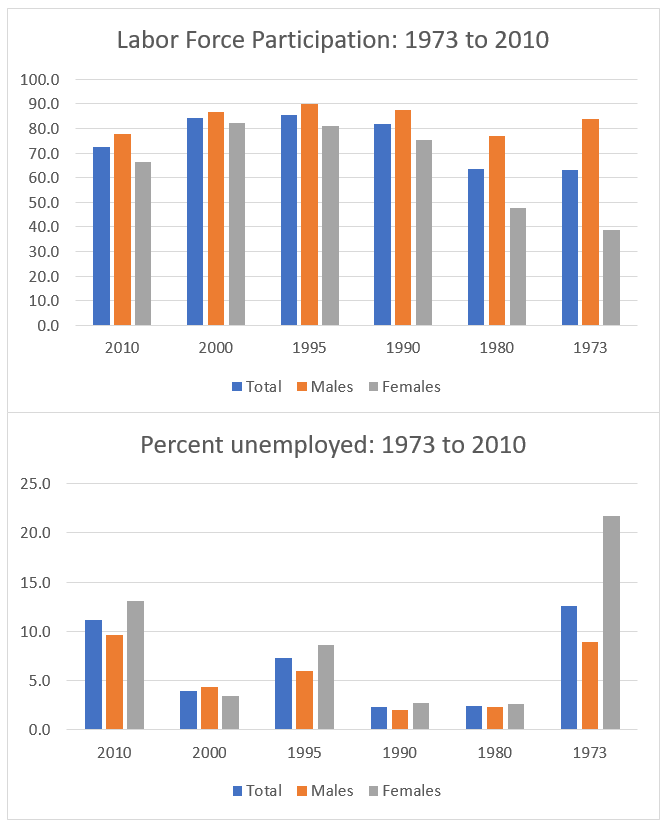
| Percent of 16 + yrs | 72.3% | 84.1% | 85.6% | 81.7% | 63.4% | 63% |
| Employed | 24,826 | 42,753 | 34,812 | 25,965 | 5,941 | 4,186 |
| At work 35 or more hours | 32,545 | 24,573 | 5,448 | 3,945 | ||
| Unemployed | 3,123 | 1,712 | 2,728 | 616 | 148 | 601 |
| Perct of civilian labor | 11.2% | 3.9% | 7.3% | 2.3% | 2.4% | 12.6% |
| Not in labor force | 10,711 | 8,427 | 6,306 | 5,933 | 3,497 | 2,814 |
SY 2017 Table 4.1 CNMI Employment Status by Sex, CNMI: 1973 to 2010 (Female)
Statistical Yearbook 2017 CNMI CSD
Note: “?” means data not available
Universe: Females 16 years and over
| Employment Status | 2010 | 2000 | 1995 | 1990 | 1980 | 1973 |
|---|---|---|---|---|---|---|
| Source: Recent Trends in Population, Current Labor Force Survey and Census 2000 Population and Housing Profiles | ||||||
| Females 16 years and over | 18,770 | 29,356 | 22,211 | 15,256 | 4,402 | 3,533 |
| In labor force | 12,498 | 24,093 | 18,033 | 11,491 | 2,094 | 1,373 |
| Percent of 16 + yrs | 66.6% | 82.1% | 81.2% | 75.3% | 47.6% | 38.9% |
| Employed | 10,864 | 23,268 | 16,475 | 11,183 | 2,039 | 1,075 |
| At work 35 or more hours | 15,359 | 10,526 | 1,777 | 995 | ||
| Unemployed | 1,630 | 825 | 1,558 | 308 | 55 | 298 |
| Perct of civilian labor | 13% | 3.4% | 8.6% | 2.7% | 2.6% | 21.7% |
| Not in labor force | 6,272 | 5,263 | 4,178 | 3,763 | 2,308 | 2,160 |
SY 2017 Table 4.1 CNMI Employment Status by Sex, CNMI: 1973 to 2010 (Male)
Statistical Yearbook 2017 CNMI CSD
Note: “?” means data not available
Universe: Males 16 years and over
| Employment Status | 2010 | 2000 | 1995 | 1990 | 1980 | 1973 |
|---|---|---|---|---|---|---|
| Source: Recent Trends in Population, Current Labor Force Survey and Census 2000 Population and Housing Profiles | ||||||
| Males 16 years and over | 19,909 | 23,542 | 21,635 | 17,266 | 5,197 | 4,068 |
| Population | 15,470 | 20,378 | 19,507 | 15,090 | 3,995 | 3,414 |
| Percent of 16 + yrs | 77.7% | 86.6% | 90.2% | 87.4% | 76.9% | 83.9% |
| Employed | 13,962 | 19,485 | 18,337 | 14,782 | 3,902 | 3,111 |
| At work 35 or more hours | 17,186 | 14,047 | 3,671 | 2,950 | ||
| Unemployed | 1,493 | 893 | 1,170 | 308 | 93 | 303 |
| Perct of civilian labor | 9.7% | 4.4% | 6% | 2% | 2.3% | 8.9% |
| Not in labor force | 4,439 | 3,164 | 2,128 | 2,170 | 1,189 | 654 |
To download HD image, right click on image and select “Save Image As”…