DescriptionTable DataChart and Figure Data
Ch.4 LABOR
Ch.4 LABOR
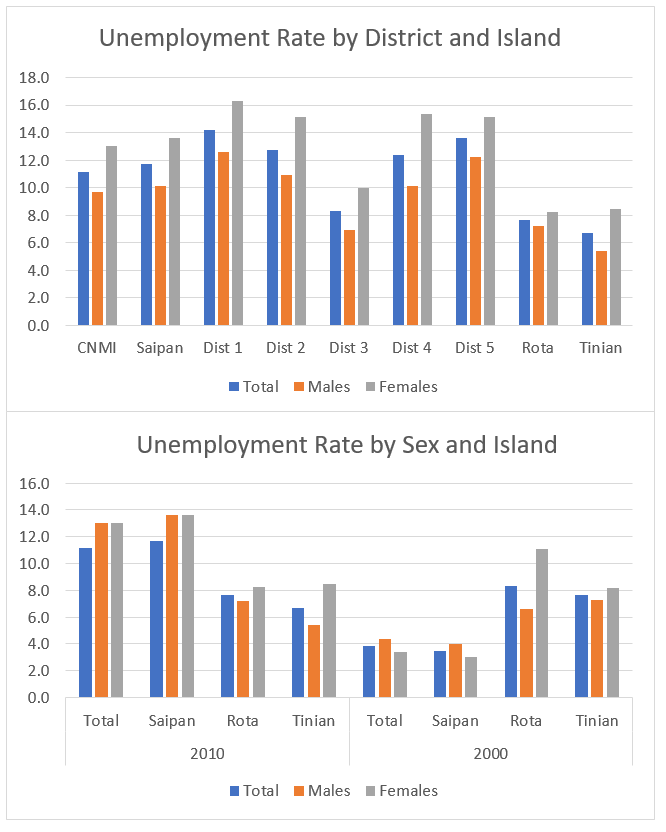
SY 2017 Table 4.2 Employment Status and Subsistence Activity by District and Island, CNMI: 2010
Statistical Yearbook 2017 CNMI CSD
Universe: Population 16 years and over
| Employment Status | Saipan District 1 |
Saipan District 2 |
Saipan District 3 |
Saipan District 4 |
Saipan District 5 |
Rota District 7 |
Tinian District 6 |
|---|---|---|---|---|---|---|---|
| Source: U.S. Census Bureau | |||||||
| In labor force | 7,449 | 3,420 | 8,701 | 1,932 | 3,224 | 1,364 | 1,878 |
| Percent | 70% | 73.2% | 75% | 70.2% | 65.4% | 76.3% | 81.3% |
| Civilian | 7,442 | 3,419 | 8,695 | 1,932 | 3,221 | 1,362 | 1,878 |
| Employed | 6,384 | 2,983 | 7,973 | 1,693 | 2,783 | 1,258 | 1,752 |
| Also did subsistence activity | 274 | 103 | 357 | 92 | 155 | 64 | 91 |
| Unemployed | 1,058 | 436 | 722 | 239 | 438 | 104 | 126 |
| Percent | 14.2% | 12.8% | 8.3% | 12.4% | 13.6% | 7.6% | 6.7% |
| Armed Forces | 7 | 1 | 6 | 0 | 3 | 2 | 0 |
| Not in labor force | 3,185 | 1,250 | 2,896 | 820 | 1,704 | 423 | 433 |
| Subsistence activity only | 59 | 19 | 50 | 26 | 50 | 22 | 8 |
SY 2017 Table 4.3 Employment Status and Subsistence Activity for Males by District and Island, CNMI: 2010
Statistical Yearbook 2017 CNMI CSD
Universe: Males 16 years and over
| Male Employment Status | Saipan District 1 |
Saipan District 2 |
Saipan District 3 |
Saipan District 4 |
Saipan District 5 |
Rota District 7 |
Tinian District 6 |
|---|---|---|---|---|---|---|---|
| Source: U.S. Census Bureau | |||||||
| In labor force | 4,166 | 1,929 | 4,711 | 1,099 | 1,710 | 781 | 1,074 |
| Percent | 76.6% | 76.8% | 80.3% | 76.5% | 70% | 80.6% | 86.4% |
| Civilian | 4,160 | 1,928 | 4,708 | 1,099 | 1,707 | 779 | 1,074 |
| Employed | 3,636 | 1,718 | 4,383 | 988 | 1,498 | 723 | 1,016 |
| Also did subsistence activity | 180 | 77 | 235 | 64 | 116 | 52 | 63 |
| Unemployed | 524 | 210 | 325 | 111 | 209 | 56 | 58 |
| Percent | 12.6% | 10.9% | 6.9% | 10.1% | 12.2% | 7.2% | 5.4% |
| Armed Forces | 6 | 1 | 3 | 0 | 3 | 2 | 0 |
| Not in labor force | 1,271 | 584 | 1,156 | 337 | 734 | 188 | 169 |
| Subsistence activity only | 36 | 10 | 33 | 10 | 36 | 17 | 5 |
SY 2017 Table 4.4 Employment Status and Subsistence Activity for Females by District and Island, CNMI: 2010
Statistical Yearbook 2017 CNMI CSD
Universe: Females 16 years and over
| Female Employment Status | Saipan District 1 |
Saipan District 2 |
Saipan District 3 |
Saipan District 4 |
Saipan District 5 |
Rota District 7 |
Tinian District 6 |
|---|---|---|---|---|---|---|---|
| Source: U.S. Census Bureau | |||||||
| In labor force | 3,283 | 1,491 | 3,990 | 833 | 1,514 | 583 | 804 |
| Percent | 63.2% | 69.1% | 69.6% | 63.3% | 61.0% | 71.3% | 75.3% |
| Civilian | 3,282 | 1,491 | 3,987 | 833 | 1,514 | 583 | 804 |
| Employed | 2,748 | 1,265 | 3,590 | 705 | 1,285 | 535 | 736 |
| Also did subsistence activity | 94 | 26 | 122 | 28 | 39 | 12 | 28 |
| Unemployed | 534 | 226 | 397 | 128 | 229 | 48 | 68 |
| Percent | 16.3% | 15.2% | 10% | 15.4% | 15.1% | 8.2% | 8.5% |
| Armed Forces | 1 | 0 | 3 | 0 | 0 | 0 | 0 |
| Not in labor force | 1,914 | 666 | 1,740 | 483 | 970 | 235 | 264 |
| Subsistence activity only | 23 | 9 | 17 | 16 | 14 | 5 | 3 |
SY 2017 Table 4.5 Employment Status and Subsistence Activity by District and Island, CNMI: 2010
Statistical Yearbook 2017 CNMI CSD
Universe: Population 16 years and over
| Employment Status | Saipan 2010 | Rota 2010 | Tinian 2010 | Saipan 2000 | Rota 2000 | Tinian 2000 |
|---|---|---|---|---|---|---|
| Source: U.S. Census Bureau | ||||||
| In labor force | 24,726 | 1,364 | 1,878 | 40,634 | 1,736 | 2,100 |
| Percent | 71.5% | 76.3% | 81.3% | 84.4% | 78.6% | 82.6% |
| Civilian | 24,709 | 1,362 | 1,878 | 40,629 | 1,736 | 2,099 |
| Employed | 21,816 | 1,258 | 1,752 | 39,223 | 1,591 | 1,938 |
| Also did subsistence activity | 981 | 64 | 91 | 802 | 173 | 104 |
| Unemployed | 2,893 | 104 | 126 | 1,406 | 145 | 161 |
| Percent | 11.7% | 7.6% | 6.7% | 3.5% | 8.4% | 7.7% |
| Armed Forces | 17 | 2 | 0 | 5 | 0 | 1 |
| Not in labor force | 9,855 | 423 | 433 | 7,508 | 473 | 442 |
| Subsistence activity only | 204 | 22 | 8 | 400 | 58 | 41 |
SY 2017 Table 4.6 Employment Status and Subsistence Activity for Males by District and Island, CNMI: 2010
Statistical Yearbook 2017 CNMI CSD
Universe: Males 16 years and over
| Employment Status | Saipan 2010 | Rota 2010 | Tinian 2010 | Saipan 2000 | Rota 2000 | Tinian 2000 |
|---|---|---|---|---|---|---|
| Source: U.S. Census Bureau | ||||||
| In labor force | 13,615 | 781 | 1,074 | 18,059 | 1,060 | 1,258 |
| Percent | 65.8% | 80.6% | 86.4% | 86.7% | 84% | 86.8% |
| Civilian | 13,602 | 779 | 1,074 | 18,054 | 1,060 | 1,258 |
| Employed | 12,223 | 723 | 1,016 | 17,328 | 990 | 1,166 |
| Also did subsistence activity | 672 | 52 | 63 | 555 | 127 | 62 |
| Unemployed | 1,379 | 56 | 58 | 726 | 70 | 92 |
| Percent | 13.6% | 7.2% | 5.4% | 4% | 6.6% | 7.3% |
| Armed Forces | 13 | 2 | 0 | 5 | 0 | 0 |
| Not in labor force | 4,082 | 188 | 169 | 2,770 | 202 | 191 |
| Subsistence activity only | 125 | 17 | 5 | 234 | 38 | 25 |
SY 2017 Table 4.7 Employment Status and Subsistence Activity for Females by District and Island, CNMI: 2010
Statistical Yearbook 2017 CNMI CSD
Universe: Females 16 years and over
| Employment Status | Saipan 2010 | Rota 2010 | Tinian 2010 | Saipan 2000 | Rota 2000 | Tinian 2000 |
|---|---|---|---|---|---|---|
| Source: U.S. Census Bureau | ||||||
| In labor force | 11,111 | 583 | 804 | 22,575 | 676 | 842 |
| Percent | 65.8% | 71.3% | 75.3% | 82.7% | 71.4% | 77.0% |
| Civilian | 11,107 | 583 | 804 | 22,575 | 676 | 841 |
| Employed | 9,593 | 535 | 736 | 21,895 | 601 | 772 |
| Also did subsistence activity | 309 | 12 | 28 | 247 | 46 | 42 |
| Unemployed | 1,514 | 48 | 68 | 680 | 75 | 69 |
| Percent | 13.6% | 8.2% | 8.5% | 3.0% | 11.1% | 8.2% |
| Armed Forces | 4 | 0 | 0 | 0 | 0 | 1 |
| Not in labor force | 5,773 | 235 | 264 | 4,738 | 271 | 251 |
| Subsistence activity only | 79 | 5 | 3 | 166 | 20 | 16 |
To download HD image, right click on image and select “Save Image As”…