DescriptionTable DataChart and Figure Data
Ch.4 LABOR
Ch.4 LABOR
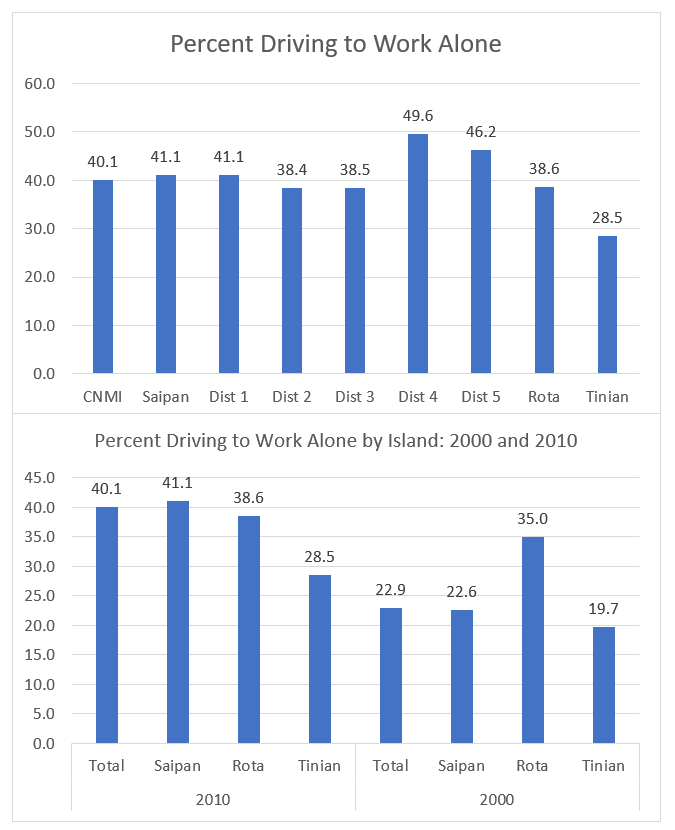
SY 2017 Table 4.21 Commuting to Work for Workers 16 years and over by District and Island, CNMI: 2010
Statistical Yearbook 2017 CNMI CSD
Universe: Workers 16 years and over
| Commuting | Saipan District 1 |
Saipan District 2 |
Saipan District 3 |
Saipan District 4 |
Saipan District 5 |
Rota District 7 |
Tinian District 6 |
|---|---|---|---|---|---|---|---|
| Source: U.S. Census Bureau | |||||||
| Private vehicle – drive alone | 2,595 | 1,129 | 3,032 | 832 | 1,269 | 482 | 494 |
| Private vehicle – carpooled | 2,349 | 874 | 2,268 | 547 | 1,084 | 417 | 446 |
| Public van/bus | 4 | 2 | 10 | 2 | 3 | – | – |
| Public Boat | 11 | 6 | 12 | 2 | 2 | – | – |
| Taxicab | 107 | 84 | 176 | 11 | 24 | 1 | – |
| Motorcycle | 31 | 24 | 24 | 5 | 9 | 4 | 58 |
| Bicycle | 64 | 69 | 151 | 16 | 2 | 39 | 58 |
| Walked | 601 | 502 | 1,612 | 163 | 180 | 199 | 524 |
| Other means | 140 | 53 | 108 | 8 | 38 | 30 | 75 |
| Worked at home | 412 | 199 | 485 | 90 | 138 | 78 | 77 |
| Mean Minutes to work | 14 | 13 | 11 | 13 | 16 | 11 | 7 |
SY 2017 Table 4.22 Commuting to Work for Workers 16 years and over by District and Island, CNMI: 2010-2000
Statistical Yearbook 2017 CNMI CSD
Universe: Workers 16 years and over
| Commuting | Saipan 2010 | Rota 2010 | Tinian 2010 | Saipan 2000 | Rota 2000 | Tinian 2000 |
|---|---|---|---|---|---|---|
| Source: U.S. Census Bureau | ||||||
| Private vehicle – drive alone | 8,857 | 482 | 494 | 9,596 | 547 | 378 |
| Private vehicle – carpooled | 7,122 | 417 | 446 | 13,897 | 558 | 578 |
| Public van/bus | 21 | – | – | 192 | 5 | 2 |
| Public Boat | 33 | – | – | 23 | 1 | 2 |
| Taxicab | 402 | 1 | – | 41 | – | 2 |
| Motorcycle | 93 | 4 | 58 | 28 | 3 | 7 |
| Bicycle | 302 | 39 | 58 | 222 | 32 | 20 |
| Walked | 3,058 | 199 | 524 | 15,780 | 300 | 815 |
| Other means | 347 | 30 | 75 | 789 | 18 | 17 |
| Worked at home | 1,324 | 78 | 77 | 1,873 | 100 | 98 |
| Mean Minutes to work | 13 | 11 | 7 | 10 | 11 | 7 |
To download HD image, right click on image and select “Save Image As”…