DescriptionTable DataChart and Figure Data
Ch.4 LABOR
Ch.4 LABOR
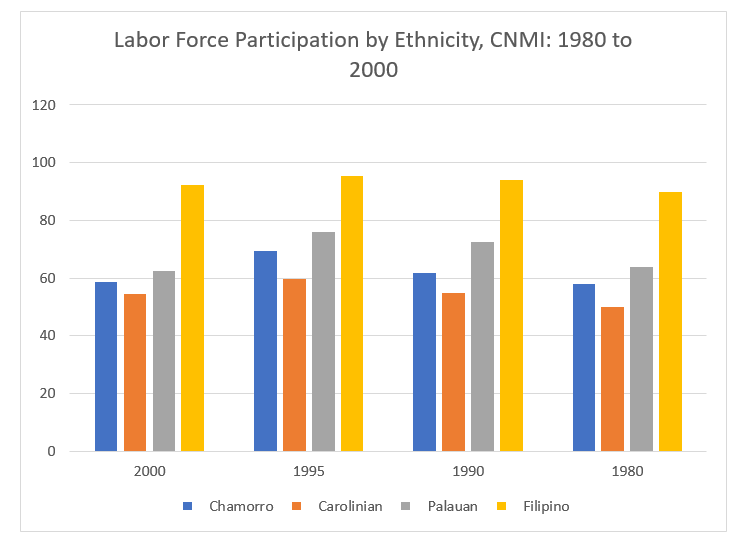
SY 2017 Table 4.8 Labor Force Participation by Ethnicity, CNMI: 1980, 1990, 1995 and 2000
Statistical Yearbook 2017 CNMI CSD
Note: Values are percent in the labor force
Universe: Persons 16 + years
| Ethnicity | 2000 | 1995 | 1990 | 1980 |
|---|---|---|---|---|
| Source: Recent Trends in Population, Labor Force Force Survey Table A12.0 and 2002 CNMI American Community Survey | ||||
| Chamorro | 58.7 | 69.4 | 61.9 | 58.1 |
| Carolinian | 54.4 | 59.6 | 54.7 | 49.8 |
| Palauan | 62.4 | 76 | 72.4 | 63.9 |
| Other Micronesia | 62.6 | 68.2 | 64.1 | 51.4 |
| Filipino | 92.4 | 95.4 | 94.1 | 89.9 |
| Chinese | 99.3 | 97.3 | 97.4 | 78.3 |
| Other Asian | 79.1 | 81.9 | 85.4 | 69.9 |
| Other single | 90.3 | 91.1 | 84.5 | 76 |
| Multiple ethnic | 65.9 | 69.9 | 64.1 | 58.6 |
SY 2017 Table 4.8 Labor Force Participation by Female Ethnicity, CNMI: 1980, 1990, 1995 and 2000
Statistical Yearbook 2017 CNMI CSD
Note: Values are percent in the labor force.
Universe: Females 16 + years
| Female Ethnicity | 2000 | 1995 | 1990 | 1980 |
|---|---|---|---|---|
| Source: Recent Trends in Population, Labor Force Force Survey Table A12.0 and 2002 CNMI American Community Survey | ||||
| Chamorro | 50.8 | 62 | 52.4 | 45.8 |
| Carolinian | 42.1 | 46 | 44.4 | 36.7 |
| Palauan | 62.4 | 66.7 | 65.9 | 56.7 |
| Other Micronesia | 49.8 | 57.2 | 52.4 | 32.4 |
| Filipino | 88.6 | 92.3 | 89.8 | 72.5 |
| Chinese | 99.1 | 97.5 | 97.8 | 54.5 |
| Other Asian | 70.4 | 70 | 82.3 | 38 |
| Other single | 80.9 | 83.2 | 75.1 | 58.1 |
| Multiple ethnic | 58.8 | 63.2 | 57.2 | 48.1 |
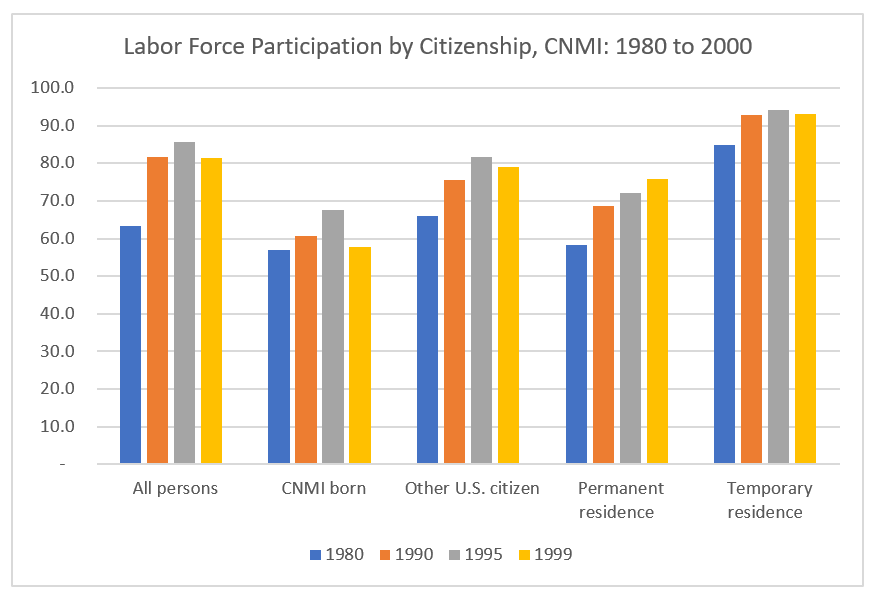
SY 2017 Table 4.9 Labor Force Participation by Citizenship Status, CNMI: 1973, 1980, 1990, 1995 and 2000
Statistical Yearbook 2017 CNMI CSD
Universe: Persons 16+ years
| Citizenship Status | 2000 | 1995 | 1990 | 1980 | 1973 | |
|---|---|---|---|---|---|---|
| Source: Recent Trends in Population, Labor Force Survey Table A10.0 and Population and Housing Profiles, US Census Bureau, 2000. | ||||||
| U.S. Citizen | CNMI born | 12,560 | 7,050 | 5,085 | 3,388 | 3,092 |
| U.S. Citizen | Other U.S. citizen | 1,960 | 2,970 | 1,600 | 399 | 380 |
| U.S. Citizen | Not a Citizen | 32,857 | 27,520 | 19,896 | 2,302 | 1,315 |
| U.S. Citizen | Permanent residence | 3,900 | 1,706 | 1,522 | 620 | 538 |
| U.S. Citizen | Temporary residence | 28,957 | 25,814 | 18,374 | 1,682 | 777 |
| Females 16+ years | U.S. Citizen | 7,782 | 4,189 | 2,688 | 1,443 | 1,107 |
| Females 16+ years | CNMI born | 6,092 | 3,003 | 2,100 | 1,309 | 1,004 |
| Females 16+ years | Other U.S. citizen | 732 | 1,186 | 588 | 134 | 103 |
| Females 16+ years | Not a Citizen | 20,894 | 13,844 | 8,803 | 651 | 266 |
| Females 16+ years | Permanent residence | 2,374 | 774 | 713 | 260 | 155 |
| Females 16+ years | Temporary residence | 18,520 | 13,070 | 8,090 | 391 | 111 |
| Males 16+ years | U.S. Citizen | 8,467 | 5,831 | 3,997 | 2,344 | 2,365 |
| Males 16+ years | CNMI born | 6,468 | 4,047 | 2,985 | 2,079 | 2,088 |
| Males 16+ years | Other U.S. citizen | 1,228 | 1,784 | 1,012 | 265 | 277 |
| Males 16+ years | Not a Citizen | 11,963 | 13,676 | 11,093 | 1,651 | 1,049 |
| Males 16+ years | Permanent residence | 1,526 | 932 | 809 | 360 | 383 |
| Males 16+ years | Temporary residence | 10,437 | 12,744 | 10,284 | 1,291 | 666 |
To download HD image, right click on image and select “Save Image As”…