DescriptionTable DataChart and Figure Data
Ch.6 PUBLIC SAFETY
Ch.6 PUBLIC SAFETY
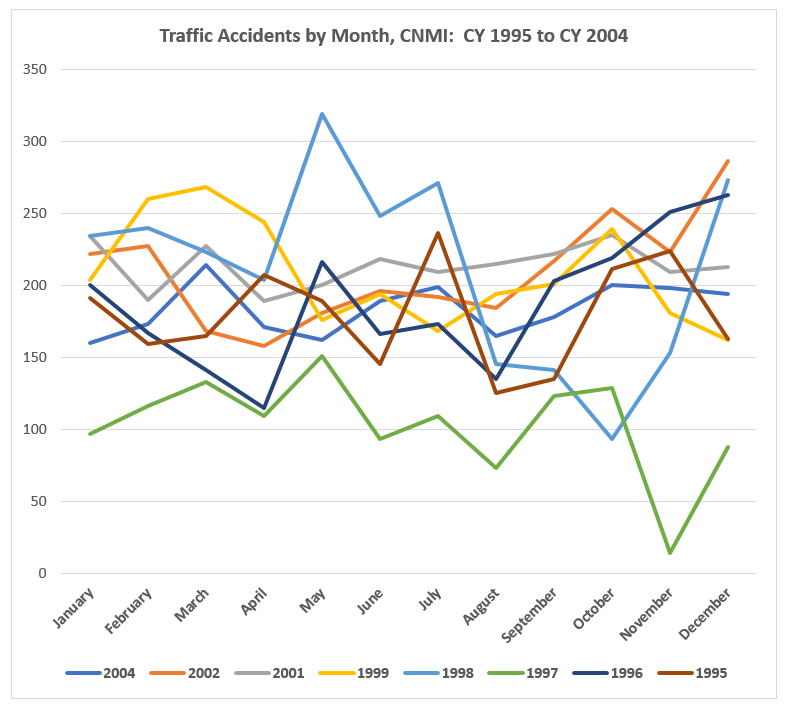
SY 2017 Table 6.3 Number of Traffic Accidents by Month, CNMI: CY 1995 to CY 2004
Statistical Yearbook 2017 CNMI CSD
Note: No compiled figures for 2000 and 2003
| 2004 | 2002 | 2001 | 1999 | 1998 | 1997 | 1996 | 1995 | |
|---|---|---|---|---|---|---|---|---|
| Source: Department of Public Safety, Criminal Justice Planning Agency | ||||||||
| January | 160 | 222 | 234 | 204 | 234 | 97 | 200 | 191 |
| February | 173 | 227 | 190 | 260 | 240 | 116 | 167 | 159 |
| March | 214 | 168 | 227 | 268 | 223 | 133 | 141 | 165 |
| April | 171 | 158 | 189 | 244 | 204 | 109 | 115 | 207 |
| May | 162 | 181 | 200 | 176 | 319 | 151 | 216 | 189 |
| June | 189 | 196 | 218 | 194 | 248 | 93 | 166 | 145 |
| July | 199 | 192 | 209 | 168 | 271 | 109 | 173 | 236 |
| August | 165 | 184 | 215 | 194 | 145 | 73 | 135 | 125 |
| September | 178 | 217 | 222 | 201 | 141 | 123 | 203 | 135 |
| October | 200 | 253 | 235 | 239 | 93 | 129 | 219 | 211 |
| November | 198 | 223 | 209 | 181 | 153 | 14 | 251 | 224 |
| December | 194 | 286 | 213 | 162 | 273 | 88 | 263 | 163 |
To download HD image, right click on image and select “Save Image As”…