DescriptionTable DataChart and Figure Data
Ch.9 HOUSING
Ch.9 HOUSING
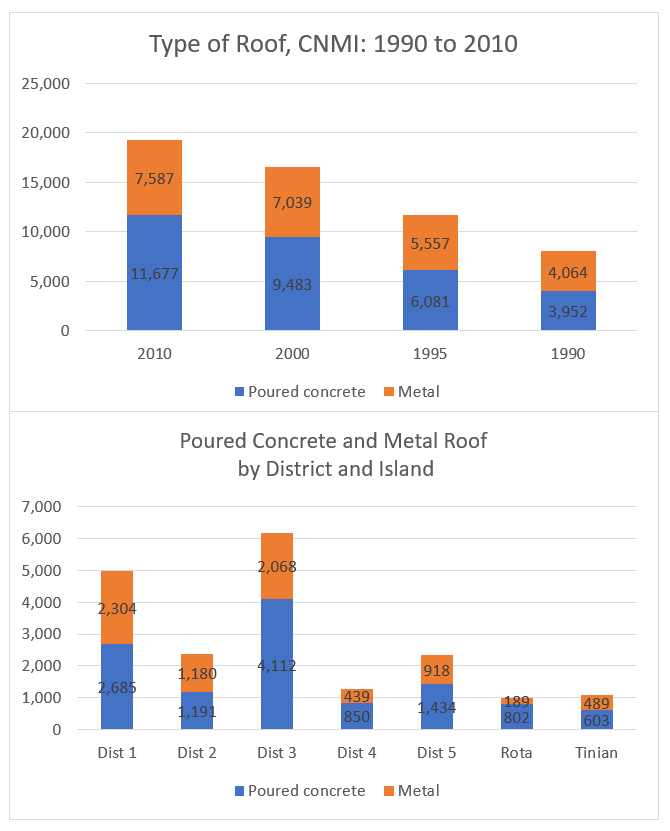
SY 2017 Table 9.11 Material for Roof, CNMI: 1990 to 2010
Statistical Yearbook 2017 CNMI CSD
Universe: Total housing units
| 2010 | 2010 | 2000-2010 | 2000 | 2000 | 1995-2000 | 1995 | 1995 | 1990-1995 | 1990 | 1990 | |
|---|---|---|---|---|---|---|---|---|---|---|---|
| Source: 1990 Census Table 105, 1995 CNMI Mid-Decade Census Table 148 and Census 2000 and 2010 Population and Housing Profiles | |||||||||||
| Concrete | 11,677 | 56.0% | 23.1% | 9,483 | 54.0% | 55.9% | 6,081 | 50.4% | 53.9% | 3,952 | 48.1% |
| Metal | 7,587 | 36.4% | 7.8% | 7,039 | 40.1% | 26.7% | 5,557 | 46.1% | 36.7% | 4,064 | 49.5% |
| Wood | 477 | 2.3% | 24.2% | 384 | 2.2% | 21.1% | 317 | 2.6% | 155.6% | 124 | 1.5% |
| Other | 1,109 | 5.3% | 68.0% | 660 | 3.8% | 547.1% | 102 | 0.8% | 45.7% | 70 | 0.9% |
SY 2017 Table 9.12 Material used for Roof by District and Island, CNMI: 2010
Statistical Yearbook 2017 CNMI CSD
Universe: Total housing units
| Saipan District 1 |
Saipan District 2 |
Saipan District 3 |
Saipan District 4 |
Saipan District 5 |
Tinian District 6 |
Rota District 7 |
|
|---|---|---|---|---|---|---|---|
| Source: U.S. Census Bureau | |||||||
| Poured concrete | 2,685 | 1,191 | 4,112 | 850 | 1,434 | 603 | 802 |
| Metal | 2,304 | 1,180 | 2,068 | 439 | 918 | 489 | 189 |
| Wood | 114 | 45 | 189 | 58 | 42 | 10 | 19 |
| Other | 376 | 111 | 406 | 32 | 129 | 16 | 39 |
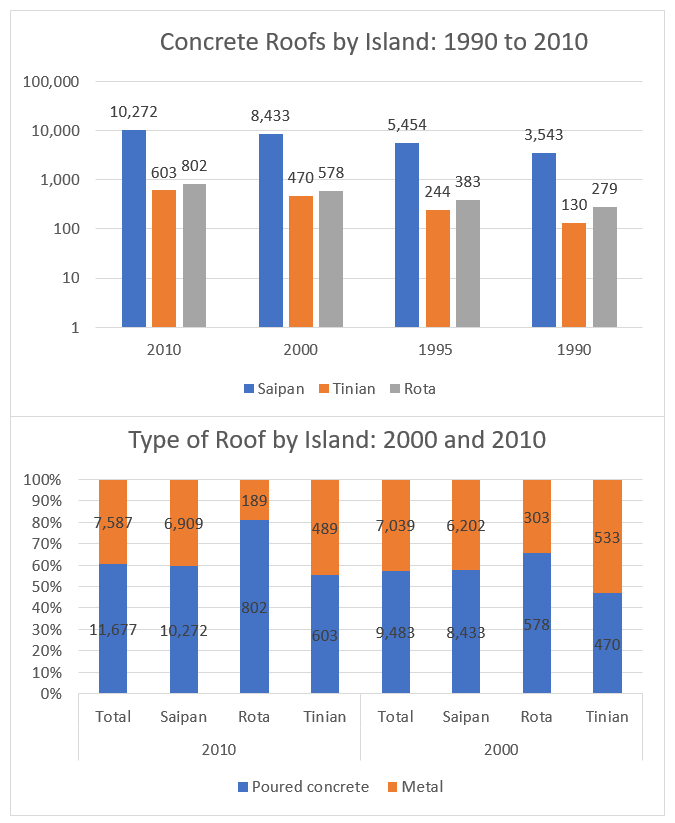
SY 2017 Table 9.13 Material for Roof, CNMI: 1990 to 2010 (SAIPAN)
Statistical Yearbook 2017 CNMI CSD
| Saipan | 2010 | 2000 | 1995 | 1990 |
|---|---|---|---|---|
| Source: 1990 Census Table 105, 1995 CNMI Mid-Decade Census Table 148 and Census 2000 Population and Housing Profiles | ||||
| Concrete | 10,272 | 8,433 | 5,454 | 3,543 |
| Metal | 6,909 | 6,202 | 5,035 | 3,518 |
| Wood | 448 | 350 | 258 | 122 |
| Other | 1,054 | 542 | 97 | 68 |
SY 2017 Table 9.13 Material for Roof, CNMI: 1990 to 2010 (TINIAN)
Statistical Yearbook 2017 CNMI CSD
| Tinian | 2010 | 2000 | 1995 | 1990 |
|---|---|---|---|---|
| Source: 1990 Census Table 105, 1995 CNMI Mid-Decade Census Table 148 and Census 2000 Population and Housing Profiles | ||||
| Concrete | 603 | 470 | 244 | 130 |
| Metal | 489 | 533 | 221 | 299 |
| Wood | 10 | 20 | 56 | 0 |
| Other | 16 | 32 | 1 | 0 |
SY 2017 Table 9.13 Material for Roof, CNMI: 1990 to 2010 (ROTA)
Statistical Yearbook 2017 CNMI CSD
| Rota | 2010 | 2000 | 1995 | 1990 |
|---|---|---|---|---|
| Source: 1990 Census Table 105, 1995 CNMI Mid-Decade Census Table 148 and Census 2000 Population and Housing Profiles | ||||
| Concrete | 802 | 578 | 383 | 279 |
| Metal | 189 | 303 | 300 | 236 |
| Wood | 19 | 14 | 3 | 2 |
| Other | 39 | 86 | 4 | 2 |
Ch.9 HOUSING
To download HD image, right click on image and select “Save Image As”…