DescriptionTable DataChart and Figure Data
Ch.9 HOUSING
Ch.9 HOUSING
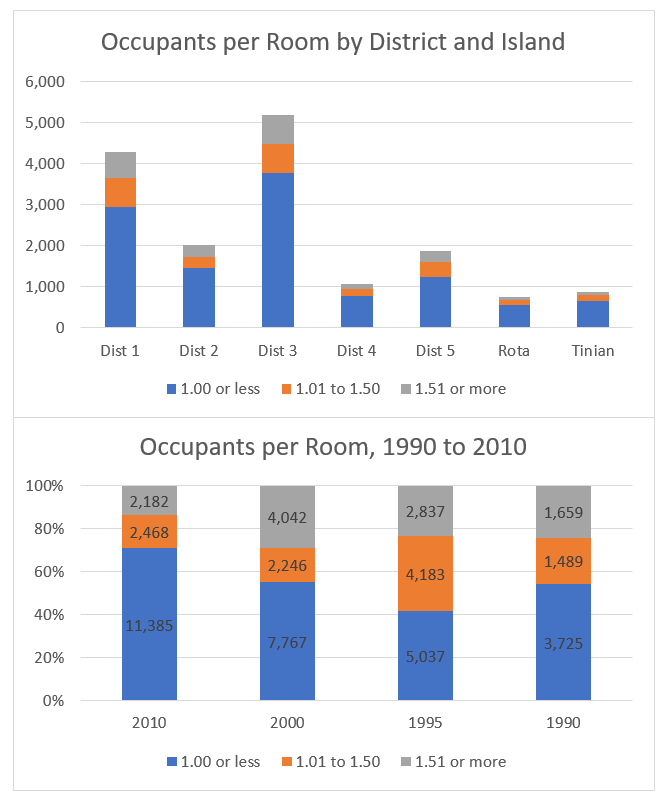
SY 2017 Table 9.19 Occupants per Room by District and Island, CNMI: 2010
Statistical Yearbook 2017 CNMI CSD
Universe: Occupied housing units
| Saipan District 1 |
Saipan District 2 |
Saipan District 3 |
Saipan District 4 |
Saipan District 5 |
Tinian District 6 |
Rota District 7 |
|
|---|---|---|---|---|---|---|---|
| Source: U.S. Census Bureau | |||||||
| 1.00 or less | 2,939 | 1,443 | 3,769 | 783 | 1,239 | 653 | 559 |
| 1.01 to 1.50 | 721 | 291 | 699 | 154 | 353 | 132 | 118 |
| 1.51 or more | 627 | 276 | 715 | 129 | 268 | 89 | 78 |
SY 2017 Table 9.20 Occupants per Room by Island, CNMI: 2010
Statistical Yearbook 2017 CNMI CSD
Universe: Occupied housing units
| 2010 | Saipan | Rota | Tinian |
|---|---|---|---|
| Source: U.S. Census Bureau | |||
| 1.00 or less | 10,173 | 559 | 653 |
| 1.01 to 1.50 | 2,218 | 118 | 132 |
| 1.51 or more | 2,015 | 78 | 89 |
SY 2017 Table 9.20 Occupants per Room by Island, CNMI: 2000
Statistical Yearbook 2017 CNMI CSD
Universe: Occupied housing units
| 2000 | Saipan | Rota | Tinian |
|---|---|---|---|
| Source: U.S. Census Bureau | |||
| 1.00 or less | 6,866 | 463 | 438 |
| 1.01 to 1.50 | 1,978 | 136 | 131 |
| 1.51 or more | 3,663 | 158 | 221 |
SY 2017 Table 9.21 Occupants per Room, CNMI: 1990 to 2010
Statistical Yearbook 2017 CNMI CSD
Universe: Occupied housing units
| 2010 | 2010 | 2000 | 2000 | 1995 | 1995 | 1990 | 1990 | |
|---|---|---|---|---|---|---|---|---|
| Source: U.S. Census Bureau | ||||||||
| 1.00 or less | 11,385 | 71.0% | 7,767 | 55.3% | 5,037 | 41.8% | 3,725 | 54.2% |
| 1.01 to 1.50 | 2,468 | 15.4% | 2,246 | 16.0% | 4,183 | 34.7% | 1,489 | 21.7% |
| 1.51 or more | 2,182 | 13.6% | 4,042 | 28.8% | 2,837 | 23.5% | 1,659 | 24.1% |
Ch.9 HOUSING
To download HD image, right click on image and select “Save Image As”…