DescriptionTable DataChart and Figure Data
Ch.9 HOUSING
Ch.9 HOUSING
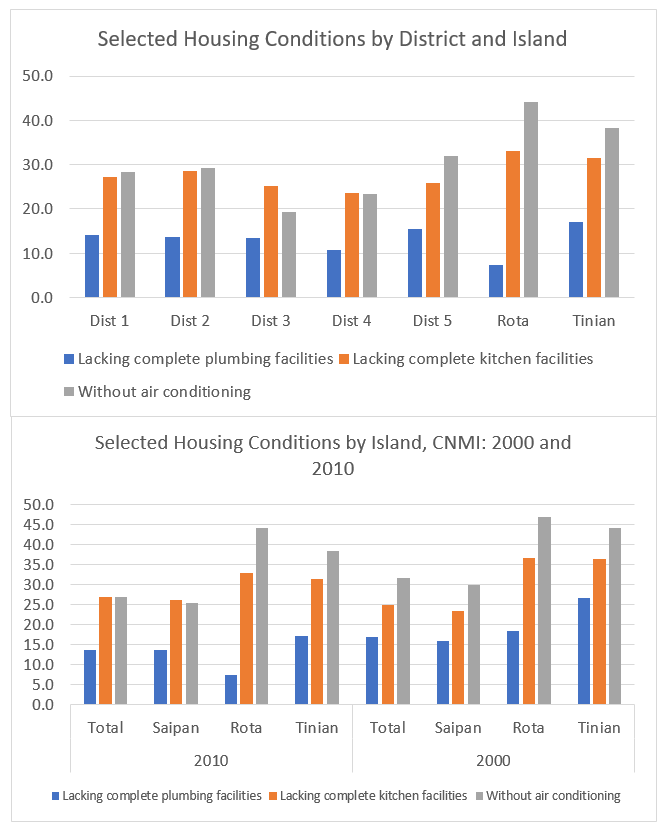
SY 2017 Table 9.24 Selected Housing Conditions by District and Island, CNMI: 2010
Statistical Yearbook 2017 CNMI CSD
Universe: Total housing units
| Saipan District 1 |
Saipan District 2 |
Saipan District 3 |
Saipan District 4 |
Saipan District 5 |
Tinian District 6 |
Rota District 7 |
|
|---|---|---|---|---|---|---|---|
| Source: U.S. Census Bureau | |||||||
| Lacking complete plumbing facilities | 770 | 346 | 906 | 147 | 393 | 192 | 78 |
| Percent | 14.1% | 13.7% | 13.4% | 10.7% | 15.6% | 17.2% | 7.4% |
| Lacking complete kitchen facilities | 1,486 | 722 | 1,702 | 326 | 651 | 352 | 346 |
| Percent | 27.1% | 28.6% | 25.1% | 23.6% | 25.8% | 31.5% | 33.0% |
| Without air conditioning | 1,558 | 742 | 1,307 | 324 | 808 | 429 | 463 |
| Percent | 28.4% | 29.4% | 19.3% | 23.5% | 32.0% | 38.4% | 44.1% |
SY 2017 Table 9.25 Selected Housing Conditions by District and Island, CNMI: 2010
Statistical Yearbook 2017 CNMI CSD
Universe: Total housing units
| 2010 | Saipan | Rota | Tinian |
|---|---|---|---|
| Source: U.S. Census Bureau | |||
| Lacking complete plumbing facilities | 2,562 | 78 | 192 |
| Percent | 13.7% | 7.4% | 17.2% |
| Lacking complete kitchen facilities | 4,887 | 346 | 352 |
| Percent | 26.2% | 33.0% | 31.5% |
| Without air conditioning | 4,739 | 463 | 429 |
| Percent | 25.4% | 44.1% | 38.4% |
SY 2017 Table 9.25 Selected Housing Conditions by District and Island, CNMI: 2000
Statistical Yearbook 2017 CNMI CSD
Universe: Total housing units
| 2000 | Saipan | Rota | Tinian |
|---|---|---|---|
| Source: U.S. Census Bureau | |||
| Lacking complete plumbing facilities | 2,490 | 181 | 280 |
| Percent | 16.0% | 18.5% | 26.5% |
| Lacking complete kitchen facilities | 3,634 | 359 | 384 |
| Percent | 23.4% | 36.6% | 36.4% |
| Without air conditioning | 4,655 | 460 | 465 |
| Percent | 30.0% | 46.9% | 44.1% |
Ch.9 HOUSING
To download HD image, right click on image and select “Save Image As”…