DescriptionTable DataChart and Figure Data
Ch.9 HOUSING
Ch.9 HOUSING
SY 2017 Table 9.31 Selected Housing Conditions by District and Island, CNMI: 2010
Statistical Yearbook 2017 CNMI CSD
Universe: Occupied housing units
| Saipan District 1 |
Saipan District 2 |
Saipan District 3 |
Saipan District 4 |
Saipan District 5 |
Tinian District 6 |
Rota District 7 |
|
|---|---|---|---|---|---|---|---|
| Source: U.S. Census Bureau | |||||||
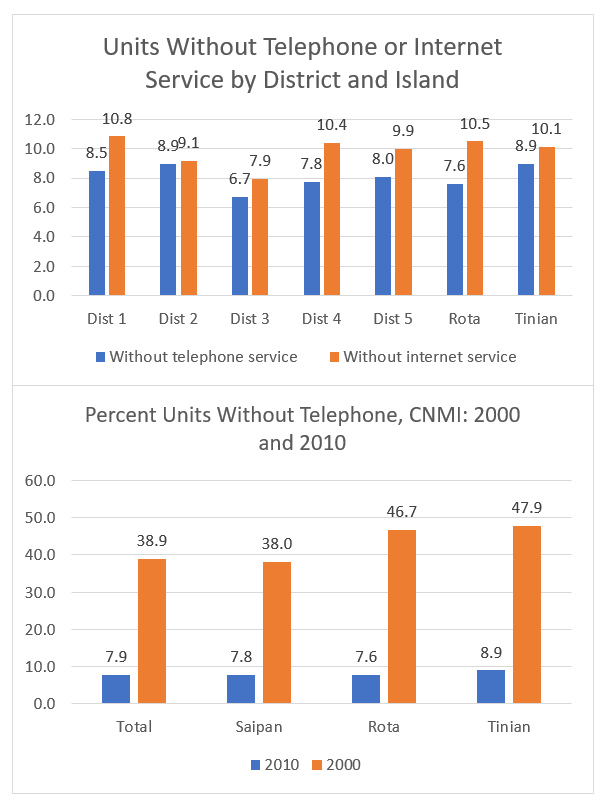
| Without telephone service | 464 | 226 | 457 | 107 | 203 | 100 | 80 |
| Percent | 8.5% | 8.9% | 6.7% | 7.8% | 8.0% | 8.9% | 7.6% |
| Without battery-operated radio | 1,681 | 896 | 2,143 | 298 | 463 | 368 | 339 |
| Percent | 30.7% | 35.5% | 31.6% | 21.6% | 18.4% | 32.9% | 32.3% |
| Without home computer or laptop | 2,335 | 1,025 | 3,235 | 609 | 1,037 | 443 | 350 |
| Percent | 42.6% | 40.6% | 47.7% | 44.2% | 41.1% | 39.6% | 33.4% |
| Without internet service | 593 | 231 | 538 | 143 | 251 | 113 | 110 |
| Percent | 10.8% | 9.1% | 7.9% | 10.4% | 9.9% | 10.1% | 10.5% |
SY 2017 Table 9.32 Selected Housing Conditions by District and Island, CNMI: 2010
Statistical Yearbook 2017 CNMI CSD
Universe: Occupied housing units
| 2010 | Saipan | Rota | Tinian |
|---|---|---|---|
| Source: U.S. Census Bureau | |||
| Without telephone service | 1,457 | 80 | 100 |
| Percent | 7.8% | 7.6% | 8.9% |
| Without battery-operated radio | 5,481 | 339 | 368 |
| Percent | 29.3% | 32.3% | 32.9% |
| Without home computer or laptop | 8,241 | 350 | 443 |
| Percent | 44.1% | 33.4% | 39.6% |
| Without internet service | 1,756 | 110 | 113 |
| Percent | 9.4% | 10.5% | 10.1% |
SY 2017 Table 9.32 Selected Housing Conditions by District and Island, CNMI: 2000
Statistical Yearbook 2017 CNMI CSD
Universe: Occupied housing units
| 2000 | Saipan | Rota | Tinian |
|---|---|---|---|
| Source: U.S. Census Bureau | |||
| Without telephone service | 4,124 | 322 | 250 |
| Percent | 38.0% | 46.7% | 47.9% |
| Without battery-operated radio | 1,593 | 77 | 83 |
| Percent | 14.7% | 11.2% | 15.9% |
| Without home computer or laptop | (NA) | (NA) | (NA) |
| Percent | (NA) | (NA) | (NA) |
| Without internet service | (NA) | (NA) | (NA) |
| Percent | (NA) | (NA) | (NA) |
Ch.9 HOUSING
To download HD image, right click on image and select “Save Image As”…