DescriptionTable DataChart and Figure Data
Ch.10 VEHICLE
Ch.10 VEHICLE
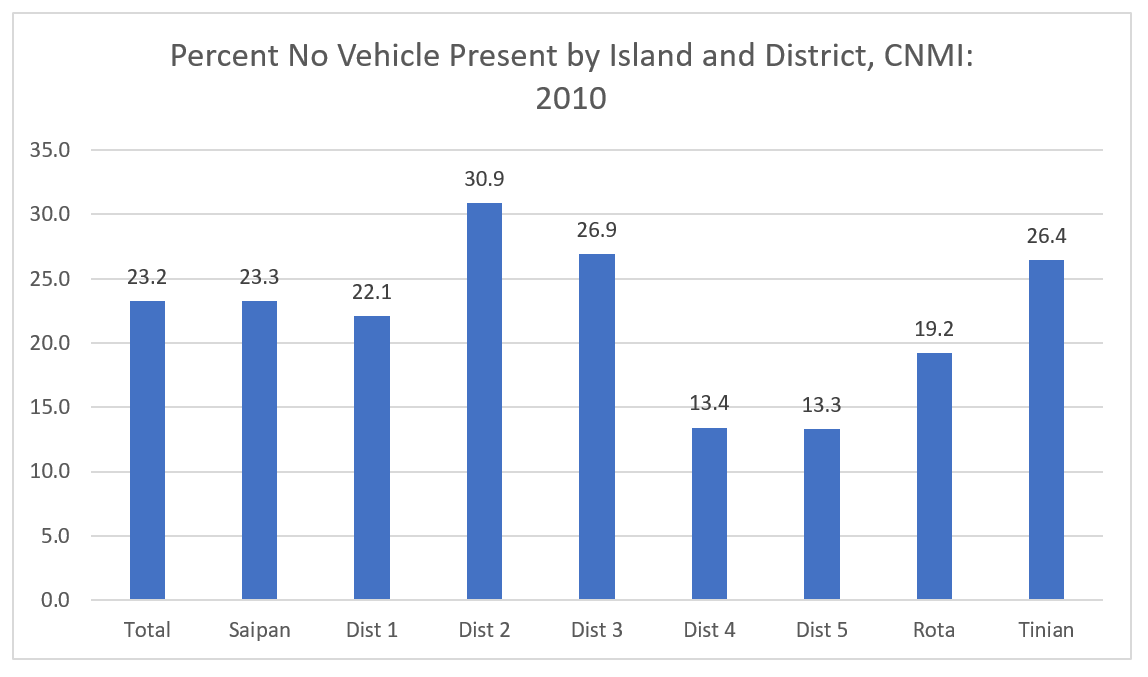
SY 2017 Table 10.1 Vehicles Available by District and Island, CNMI: 2010
Statistical Yearbook 2017 CNMI CSD
Universe: Occupied housing units
| Saipan District 1 |
Saipan District 2 |
Saipan District 3 |
Saipan District 4 |
Saipan District 5 |
Tinian District 6 |
Rota District 7 |
|
|---|---|---|---|---|---|---|---|
| Source: U.S. Census Bureau | |||||||
| No vehicle available | 946 | 621 | 1,395 | 143 | 247 | 231 | 145 |
| 1 vehicle | 2,095 | 1,015 | 2,552 | 575 | 915 | 409 | 380 |
| 2 vehicles | 892 | 277 | 887 | 247 | 510 | 175 | 172 |
| 3 or more vehicles | 354 | 97 | 349 | 101 | 188 | 59 | 58 |
SY 2017 Table 10.2 Vehicles Available by Island, CNMI: 2010
Statistical Yearbook 2017 CNMI CSD
Universe: Occupied housing units
| 2010 | Saipan | Rota | Tinian |
|---|---|---|---|
| Source: U.S. Census Bureau | |||
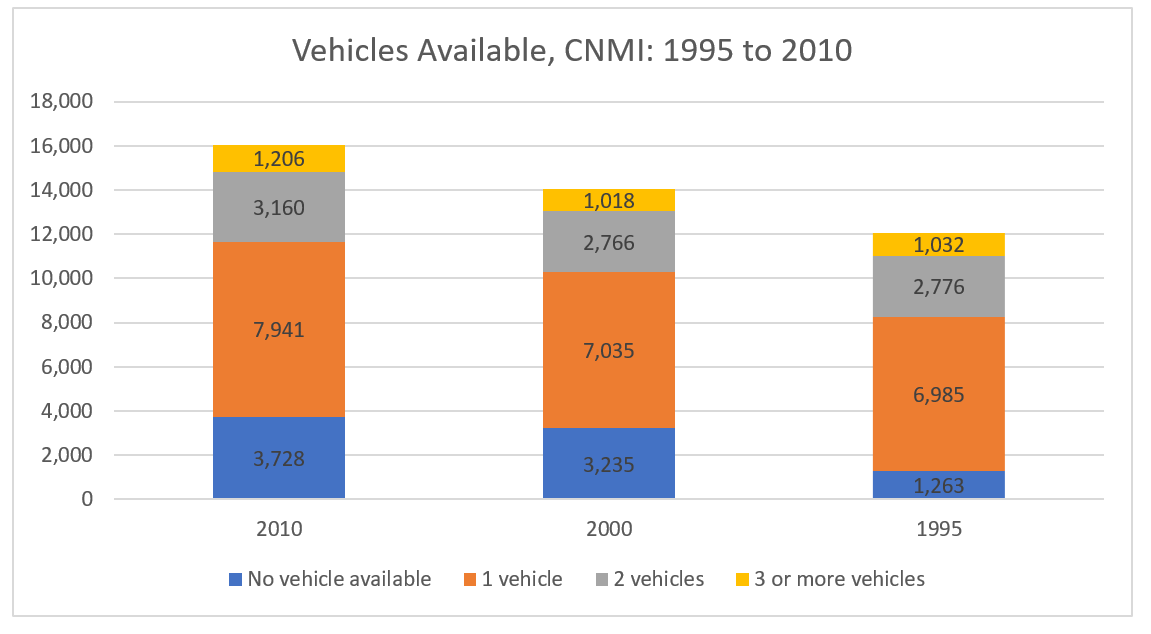
| No vehicle available | 3,352 | 145 | 231 |
| 1 vehicle | 7,152 | 380 | 409 |
| 2 vehicles | 2,813 | 172 | 175 |
| 3 or more vehicles | 1,089 | 58 | 59 |
SY 2017 Table 10.2 Vehicles Available by Island, CNMI: 2000
Statistical Yearbook 2017 CNMI CSD
Universe: Occupied housing units
| 2000 | Saipan | Rota | Tinian |
|---|---|---|---|
| Source: U.S. Census Bureau | |||
| No vehicle available | 2,873 | 148 | 214 |
| 1 vehicle | 6,237 | 374 | 424 |
| 2 vehicles | 2,475 | 187 | 104 |
| 3 or more vehicles | 922 | 48 | 48 |
SY 2017 Table 10.2 Vehicles Available by Island, CNMI: 1995
Statistical Yearbook 2017 CNMI CSD
Universe: Occupied housing units
| 1995 | Saipan | Rota | Tinian |
|---|---|---|---|
| Source: U.S. Census Bureau | |||
| No vehicle available | 1,136 | 92 | 35 |
| 1 vehicle | 6,296 | 360 | 329 |
| 2 vehicles | 2,486 | 170 | 120 |
| 3 or more vehicles | 926 | 68 | 38 |
Ch.10 VEHICLE
To download, right click the chart and select “Save Image As”…